Would you like to know how engaged are the readers of your blog?
Getting to know what your readers think about your blog is important because you can find new ways of delivering more value to them.
Now, if last week I wrote about how to measure success for your website, now it’s time to expand more on the 4th tip: “Check your Visitors’ Loyalty”. This will help you see how engaged are your readers with the content you deliver with your blog.
The way you can measure how engaged are readers on your blog is to check the metrics under the [Visitors] > [Visitors Loyalty] report in your Google Analytics account:
- Visitor Loyalty
- Visitor Recency
- Length of Visit
- Depth of Visit
Visitor Loyalty
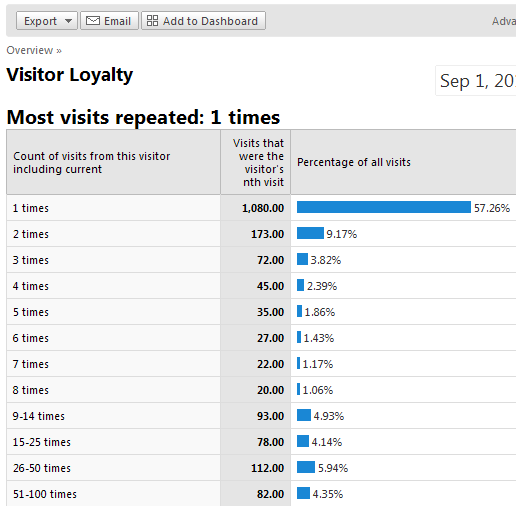
The [Visitor Loyalty] report displays, for your selected dates, how many times your readers have visited the blog.

So, now that you know what Visitor Loyalty means, let’s see what insights you can get out of it and how you can use them for your benefit.
Let’s say that you publish posts 3 times a week and suppose that your readers are 100% loyal. This means that when looking at your stats for the past week, you should see [3 times] as having the highest number of visits.
Now, are your visitors 100% loyal? Go and check your stats and see how your visitors behave for the past week or month.
Once you do that, use the [Compare to Past] option from the Calendar to compare them with the past period and see if you make any progresses.
Also, set goals for the number of visits you want to get in a specific period and check your stats towards those goals.
Visitor Recency
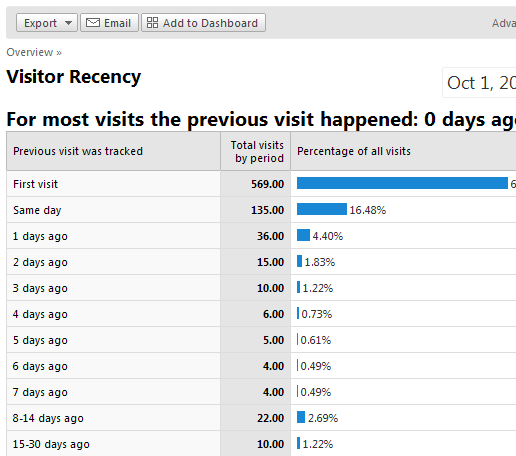
[Visitors Recency] let’s you see how many days has passed since your readers have visited your blog during a specific time period.

So, if you post daily, you should expect the most visits to be [1 day ago]. This means that your visitors come daily to your blog and read your great articles. And you should be happy about that.
Using this metric, you can see how often readers come to your blog, if your blog expects repeated visits. But what blog doesn’t expect that?
Now, to measure Visitor Recency, set goals for this metric and see how your blog performs.
Length of Visit
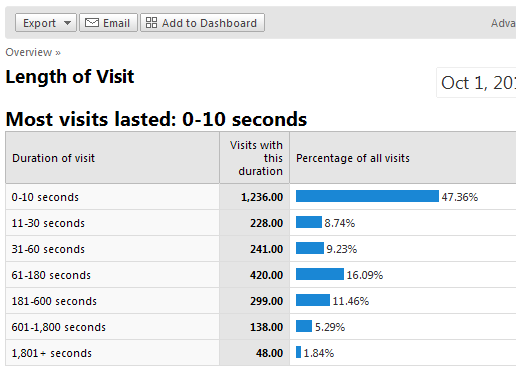
The [Length of Visit] report displays information about how much time (in seconds) a visitor has spent on your website during a single visit.

Depending on the goals of your blog and the type of blog that you have, identify how the traffic is distributed for the length of visits.
If you are used with the [Average Time on Site] metric, the [Length of Visit] report is much better. Say, for example that one visitor stays on your blog for 10 seconds, and another one stays for 1 second. The average of this is 5 seconds, but this doesn’t tell you that much.
Using the [Length of Visit] report can give you far more insights about the time your readers spend on your blog, because it tells you how the traffic is distributed for each interval. It doesn’t show you just averages.
Depth of Visit
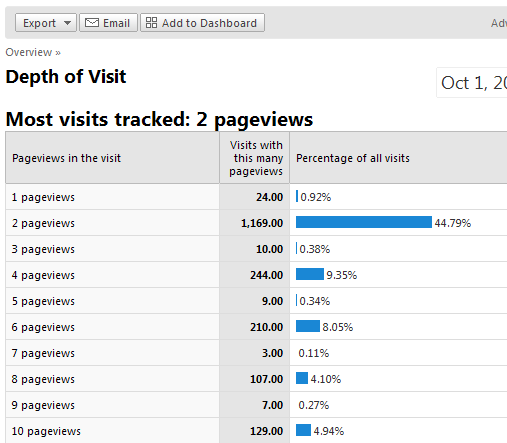
The [Depth of Visit] report displays information about how many pages your readers have viewed during a single visit for your selected time period.

This report helps you measure quality, as the more page views you have for most of your visits, the more engaged your readers are with the content from your blog.
But to measure this more effectively, again, set goals for this metric and see how your blog performs. This will give you an idea about how visitors engage with your content and helps you think at new ways of improving the content to engage your readers even more.
To learn more about how you can get your readers engaged, you can check Cristina Fugaru’s article on 5 easy steps to engage your readers. Furthermore, you can check Copyblogger’s archives as there are tons of resources on how to write effective copy.
Once you read these resources and make some improvements, check the stats again and see the difference. And if you see that difference, you can start over and make it even better.
Over to you
Are you using these metrics or any other metric to measure readers’ engagement? If you’re not using any, why? Let me know in the comments section what keeps you from doing that.
In case you are just looking at averages and overview, it’s time to dive more into your data – at least 20 minutes a week. Is not that much! Later, it will make a difference.
Convinced to get more about Web Analytics and wondering how it can help you improve your business? Then you might consider subscribing to my Google Analytics – From 0 to Analysis Ninja. It will help you get started.
PS: Many thanks to Avinash Kaushik for inspiring me to write this post.
Photo credit: Chris Suderman

Not yet – too confusing, too overwhelming. And I’m still trying to figure out my stand on the morality of all those cookies & other intrusive bits.