Is Google Analytics your go-to service for getting insights on your website traffic and making informed marketing decisions?
Have you managed to stay up to date with the latest changes and feature enhancements in Google Analytics?
Keeping track of every new improvement or new feature in Google Analytics is pretty difficult, especially if you are not active in the community or have someone dedicated to staying up to date with all the changes and reporting them to you.
That is why I decided to show you the seven most important features and enhancements added to Google Analytics recently and how to make the most of them.
I also asked top Google Analytics experts what they think about these features, and you will find their opinions in this article.
1. Calculated Metrics
Calculated Metrics is a new set of metrics that gives you the ability to create your metrics computed from existing metrics (users, sessions, conversions, conversion rate) to help you get better insights from your Google Analytics data.
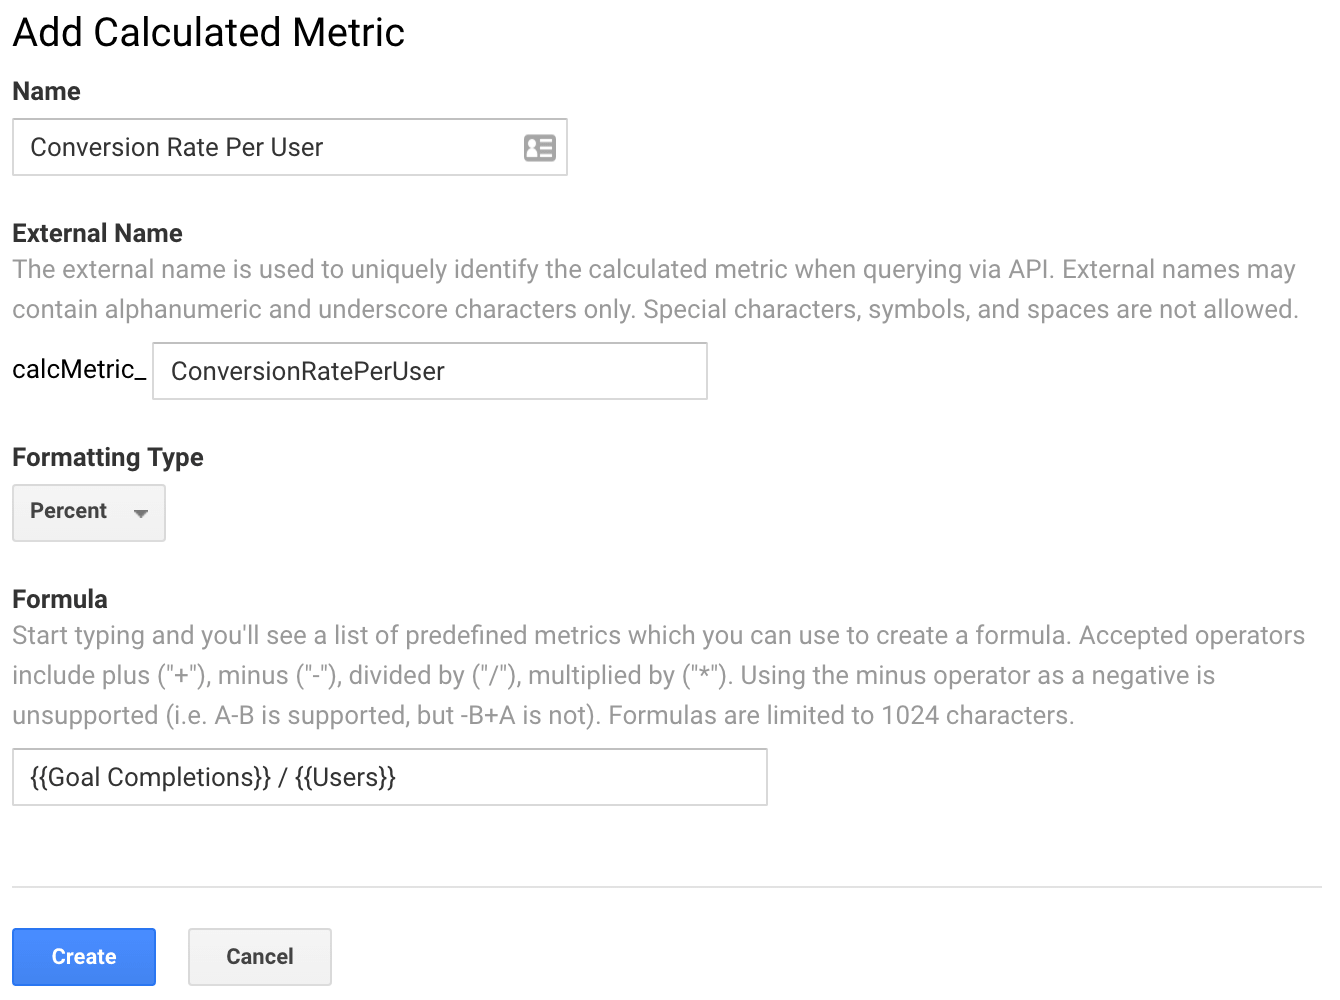
In a nutshell, you can create your metrics and add them to your custom reports and dashboards.
I find ‘calculated metrics’ feature quite useful because it provides the ability to set up and use compound metrics in GA. Its ability to work retroactively on historical data is super helpful.
Himanshu Sharma – http://optimizesmart.com/
You no longer have to be tied down to GA’s standard metrics or your custom metrics. Easily create additional metrics that are a function of your standard and custom metrics.
Vinoaj Vijeyakumaar – https://www.sparkline.com/
Calculated metrics – my number one! They provide you with greater flexibility in deriving actionable insights directly in GA. You can perform basic calculations in Google Analytics based on already available metrics and dimensions. This enables companies and individuals to better replicate their most important KPIs directly into Google Analytics and take it from there. In the free GA version, there are five slots available per view and make sure to use them all!
Paul Koks – http://online-metrics.com/
You can create Calculated Metrics from Admin > select View > Calculated Metrics > New Calculated Metric.
On the new screen you will have to add the following info:
- Name – add an easily recognizable name for your calculated metric.
- External Name – this is added automatically and used to identify the calculated metric via the API. You can change it to something else that is unique when you create the calculated metric but once saved it cannot be modified.
- Formatting type
- Integer (with customizable decimal places)
- Currency (Decimal)
- Time
- Float
- Percentage (with customizable decimal places)
- Formula – Here you can enter the formula for your calculated metric, which can include:
- Plus (+)
- Minus (-)
- Divided by (/)
- Multiplied by (*)
- Parenthesis
- Positive cardinal numbers (0-9), can add decimals
Once you start typing, you will see the predefined that you can use in your formula. Also, it’s important to note that formulas are limited to 1024 characters and that it doesn’t support the minus operator as a negative.
Once created, you can add Calculated metrics in custom reports, dashboards, widgets and analytics reporting via API.
If you use the Standard Google Analytics version, you will be able to create 5 custom metrics, while the Premium version allows you to create 50.
Now that you know why Calculated Metrics are useful and how to add them, let’s see how you can use this functionality to get more from your Google Analytics account:
- Conversion Rate per user
The default conversion rate is calculated based on the total number of sessions, and this is not accurate because users do not convert from the first session and sometimes they need more than one to convert.
Instead, you can use calculated metrics to see the exact conversion rate per user, which will give you better insights into what works best for you.
To see this information, you will have to setup a custom metric with the settings below and add it to a custom report, as Avinash Kaushik explains here:
- Name: Conversion Rate Per User
- External Name: (automatically populated)
- Formatting Type: Percent
- Formula: {{Goal Completions}} / {{Users}}
- Transactions per user
Similar to the Conversion Rate per user calculated metric, if you have an E-commerce site, you can use Transactions per user instead:
- Name: Transactions per user
- External Name: (automatically populated)
- Formatting Type: Percent
- Formula: {{Transactions}} / {{Users}}
- Revenue per user
Also, another useful calculated metric, Revenue per user, will help view the average revenue for each visitor instead of looking at the less accurate default revenue reports:
- Name: Revenue Per User
- External Name: (automatically populated)
- Formatting Type: Currency (Decimal)
- Formula: {{Revenue}} / {{Users}}
- Calculated profit
Now that revenue came up, I would like to add another example that Avinash suggested, Calculated profit, which will show the profit from particular products or services sold on a website:
- Name: Calculated profit
- External Name: (automatically populated)
- Formatting Type: Currency (Decimal)
- Formula: {{Revenue}} * 0.30
This example uses 30% as the profit margin, but you will have to figure out what is the profit margin for you and use that instead.
- Currency Conversion
If you are selling in multiple currencies or just need a currency conversion, this calculated metric can help you get that in your reports.
- Name: Revenue from GBP to USD
- External Name: (automatically populated)
- Formatting Type: Currency (Decimal)
- Formula: {{Revenue}} * 1.28
Additionally, if you want to see more examples of Calculated Metrics, check out these articles from Jill Quick, Amanda Schroeder, Georgi Georgiev, Yehoshua Coren, Benjamin Mangold and Martijn Scheijbeler.
Also, if you are looking for a more detailed analysis on how to create Calculated Metrics, you can check out Himanshu’s article on Calculated Metrics.
2. Deeper Integration with Search Console
If before there was only the option to link the Search Console with Google Analytics and see some of the Search Console data inside Google Analytics, now you can see Search Console metrics in the same reports with Google Analytics metrics.
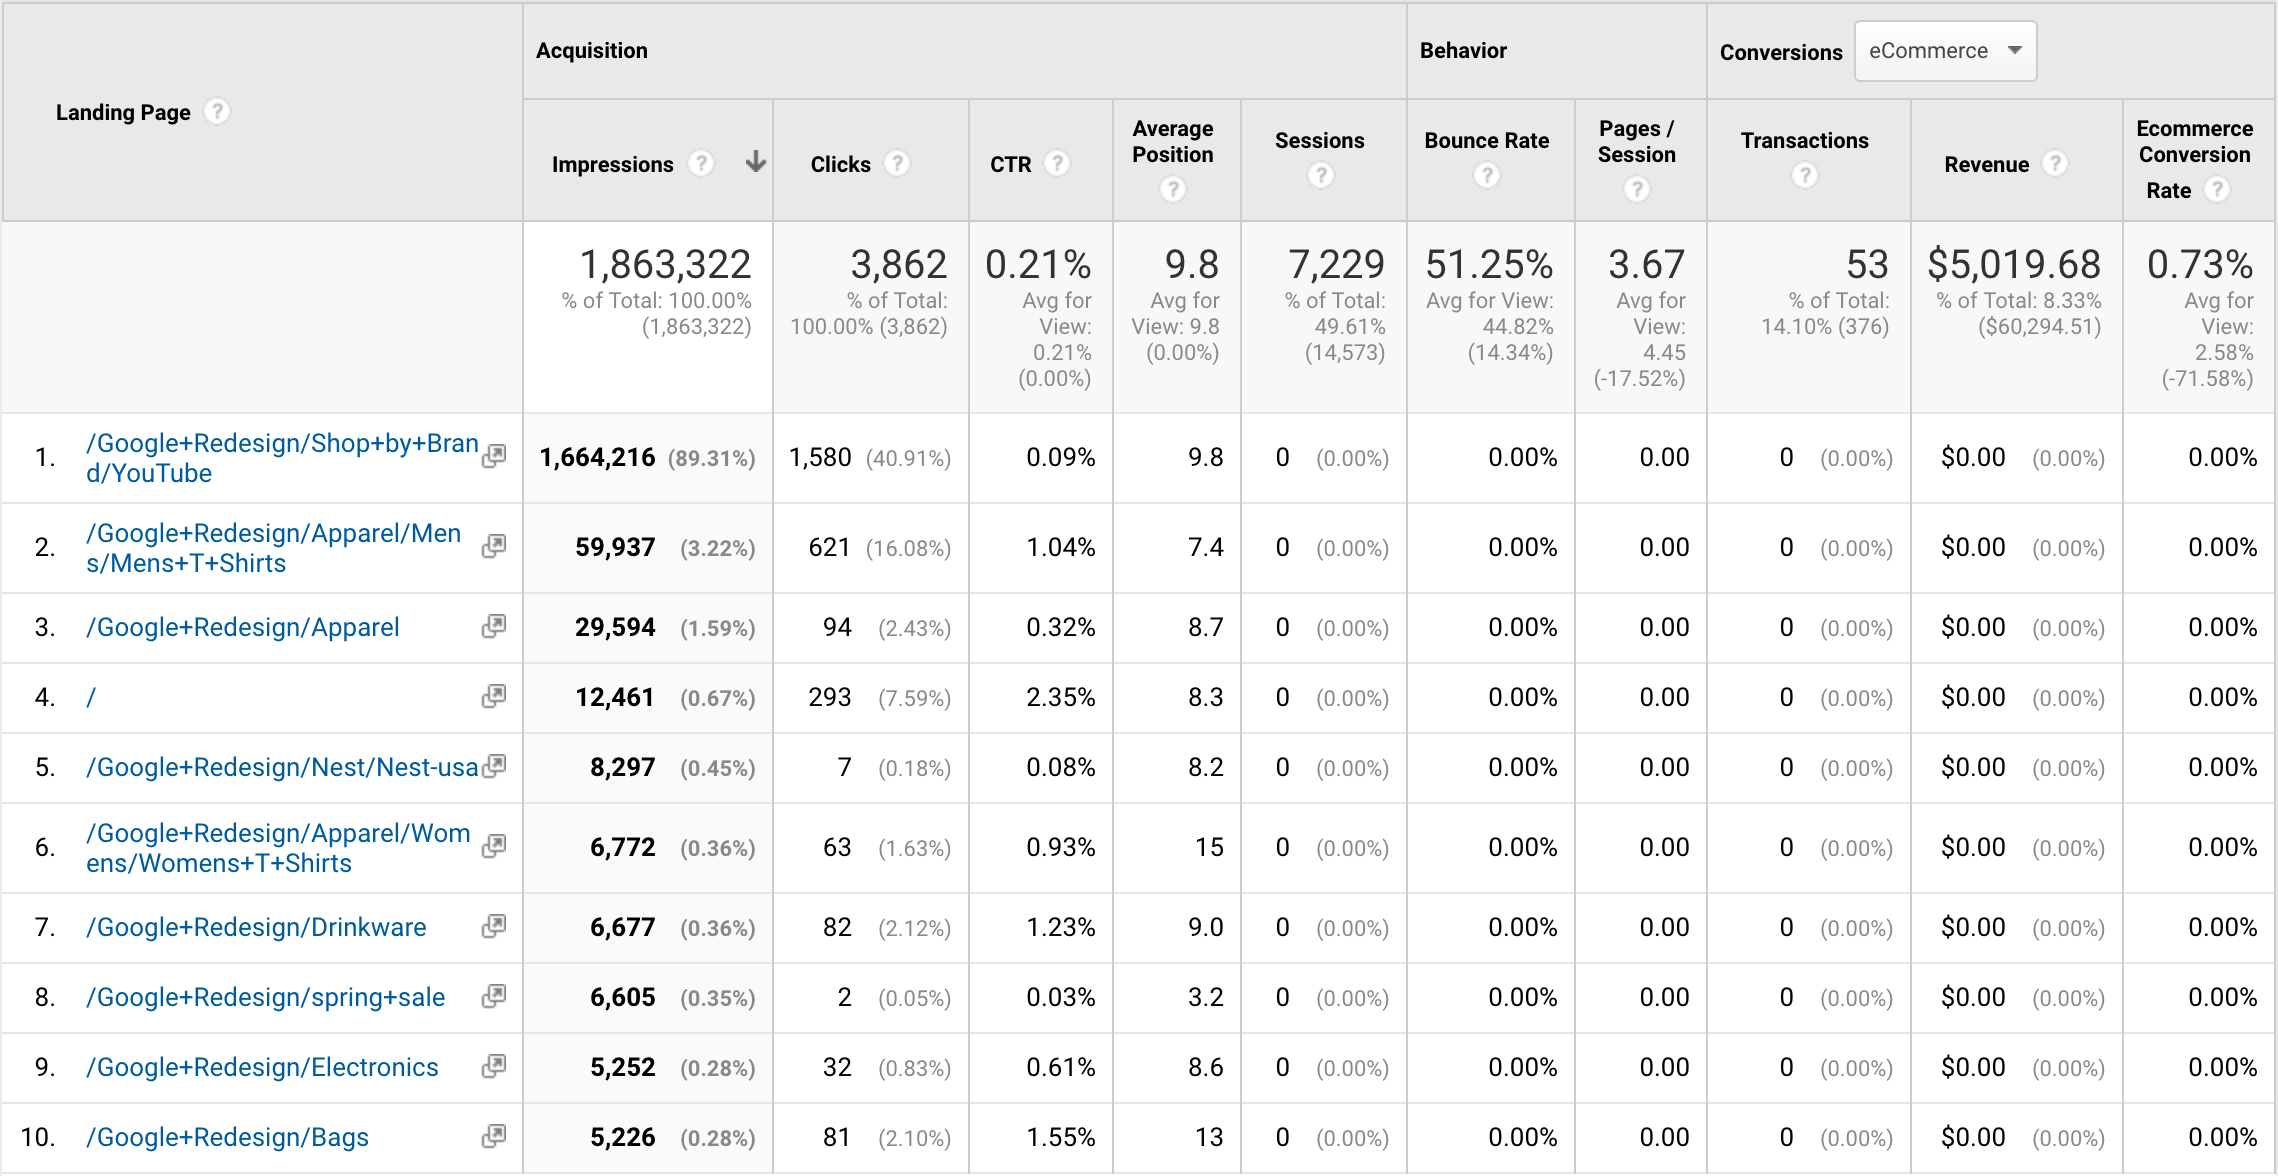
This new integration and reporting allows you to discover and get insights about search data end-to-end, by viewing data from the acquisition stage down to the conversion stage.
Among the benefits of this integration there are two that are incredibly useful:
- You will be able to view what landing pages have high organic traffic (high impressions and click through rate), but they do not engage or convert users. The report will help you identify those landing pages and improve them to increase engagement and conversions.
- You will be able to view what landing pages have high engagement and conversion rates, but they are not attracting enough users from an organic search. The report will help you identify those landing pages and improve their titles and meta descriptions in the search engines to make more people click through. You will also be able to know where to dedicate more resources to improving SEO for them.
In addition to this, you will be able to use the [Queries] report, which was available before this update, and the [Landing Pages] report to spot the keywords (and landing pages) for which you rank on the second page of Google.
You can then use this data to improve the landing pages that rank on the second page to get them on the first page of Google. Improvements can sometimes be made very quickly with updating the meta titles, description and the actual landing page to be more relevant for the keywords you are targeting.
Other times they may require additional resources, but the results will be fantastic most of the time and could lead to a high increase in organic traffic to your site.
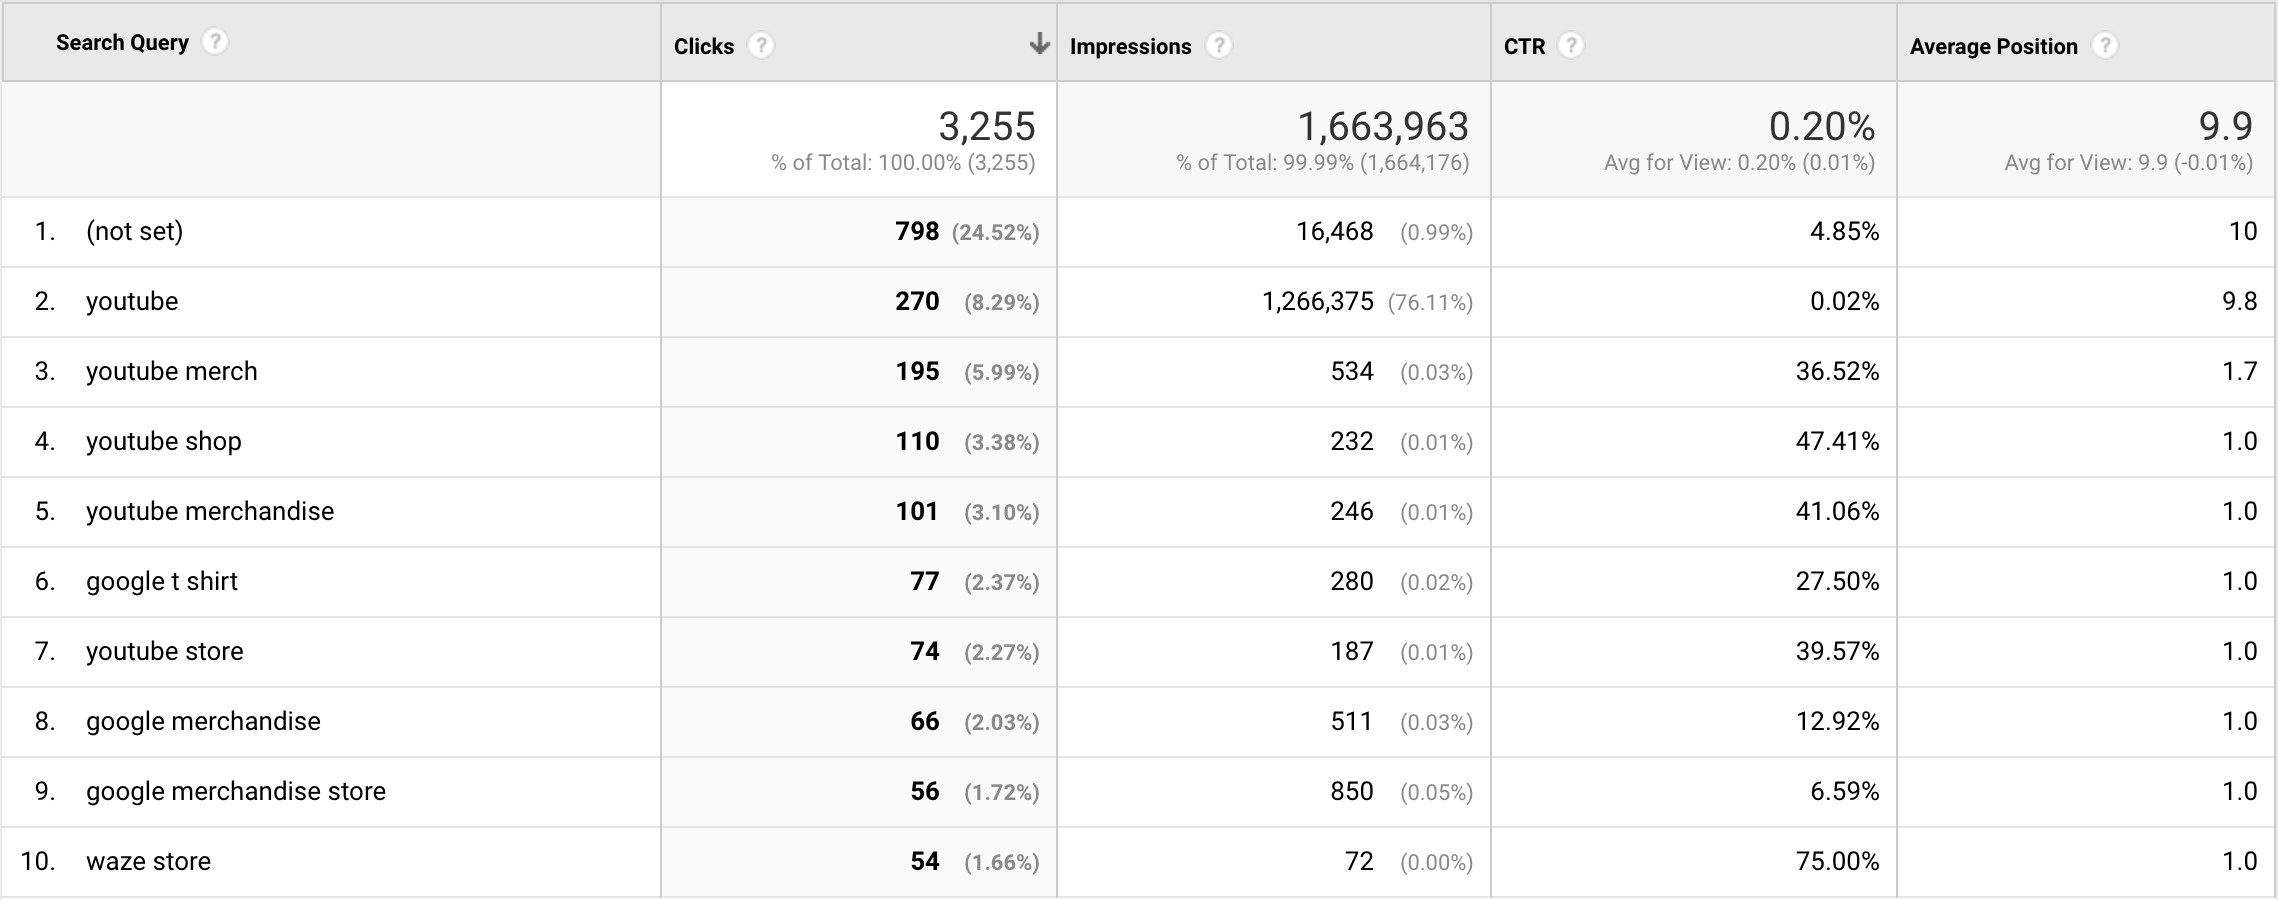
It’s important to mention that Search Console keeps data only for the last 90 days, so you won’t be able to see more than 90 days back in Google Analytics.
The data is available in Search Console only after Google processes it and that takes about 48 hours. That means that you will also see the data in Google Analytics after 48 hours, once it’s processed and added to the Search Console.
Next, before diving into how to make this work for you, let’s also see what experts are saying about it:
The feature I am most excited about is the new deep integration between Google Analytics and Search Console. Adding context to data is what makes it useful and actionable.
With this new integration, you have a whole new set of data that provides context to your SEO analysis, enabling more data-driven SEO. So instead of looking only at Search Console to learn how specific pages are performing (pre-click metrics), now it is possible to understand on a page level how your SEO is working to convert users into buyers.
Daniel Waisberg – http://online-behavior.com/
The deeper integration between Search Console and GA allows marketers and analysts to get a better feeling on how their SEO campaigns perform and it reveals key areas for improvement. The valuable post-click data for organic search – with landing page as the key – should be used by anybody who is serious about their organic performance. Yes, the post-click keyword data isn’t available still, but you have lots of other options to improve your SEO now!
Paul Koks – http://online-metrics.com/
To use this functionality, you will need to enable Search Console data sharing in your Google Analytics account, under Property Settings.
If you already have enabled Search Console data sharing, then you are all set. There is no further action you need to make.
However, if you haven’t enabled Search Console Data sharing you will need to go to Admin > select the account where you want it enabled > Property > Property Settings > scroll down to Search Console Settings.
On this section, you should see the URL of your website, and this means that you verified your site in Search Console. Otherwise, you will need to add your site to Search Console and check it.
3. Move a Property Between Accounts
Another useful feature requested for a long time is property moving.
Moving a property is necessary when your agency set up your Google Analytics tracking in their account as separate property or if you are doing a business merger or acquisition.
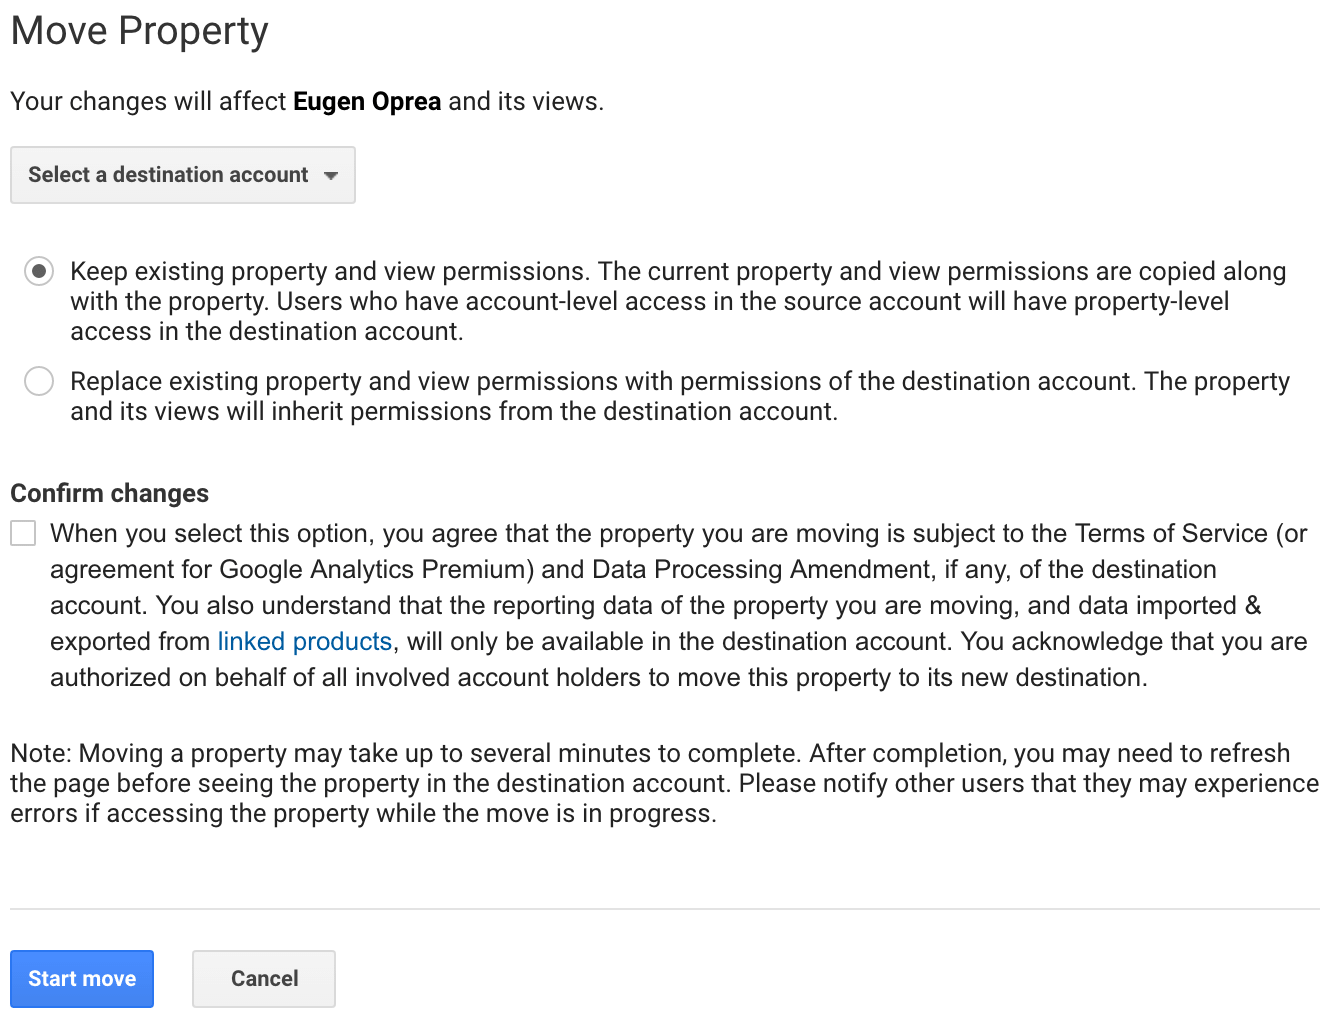
In the past, it was impossible to move properties without starting with a new account. However, now you can move properties between Google Analytics accounts quickly.
Often accounts are set up without forethought as to how the business is going to evolve and how to handle multiple stakeholders. The ability to move properties between accounts allows greater confidence in starting off with one account structure but knowing that they can then be shifted around as the business evolves.
Vinoaj Vijeyakumaar – https://www.sparkline.com/
Regarding GA account structure I so often come across organizations who made a mess of their GA account, property and view setup. This is one of the reasons why this feature is very handy. You are flexible in changing your account structure which is helpful for all of us. Getting the account setup right is a crucial starting point!
Paul Koks – http://online-metrics.com/
To be able to transfer a property to a different account, you will need to have “Manage Users” permissions for both the account you are transferring from and the destination account.
Before moving your property here is what you should keep in mind:
- Moving a property will delete it from the source account, but the empty account will still count against the maximum number of the accounts you can have in Google Analytics.
- The tracking ID won’t change, so you do not have to adjust the tracking code on your site.
- When moving a property, you have the option to replace existing property and view permissions with permissions of the destination account or keep existing property and view permissions.
- All views associated with a property are moved, along with any custom settings, filters, linked accounts, and integrations, tracking customizations, remarketing audiences, dynamic attributes, custom definitions, data import, and custom tables.
Also, there may be situations when you won’t be able to move your property to a new account. The following is a list of some of the reasons:
- The destination account already has the maximum number of properties (50 by default or 200 for Google Analytics 360.)
- You do not have the required permissions for the target account.
- You linked the property to DoubleClick for Publishers.
- The property is a Roll-Up Property or a Source Property of your Google Analytics 360.
In case you want more details about the benefits of this functionality, you can check out this article from Carlos Escalera (Ohow) and this Google Analytics Help article.
To move a property from a Google Analytics account to another you will have to go to “Property Settings,” then click “Move property” and select the destination account.
Finally, you will have to choose your permissions settings, and you’re done. The move should take only a few minutes, and there you will see the property in your destination account.
4. Google Analytics Demo Account
If you ever wanted to get a better perspective on what data you can have available in Google Analytics, experiment with data, and learn how Google Analytics works, then the new Google Analytics demo account is something you want to check out.
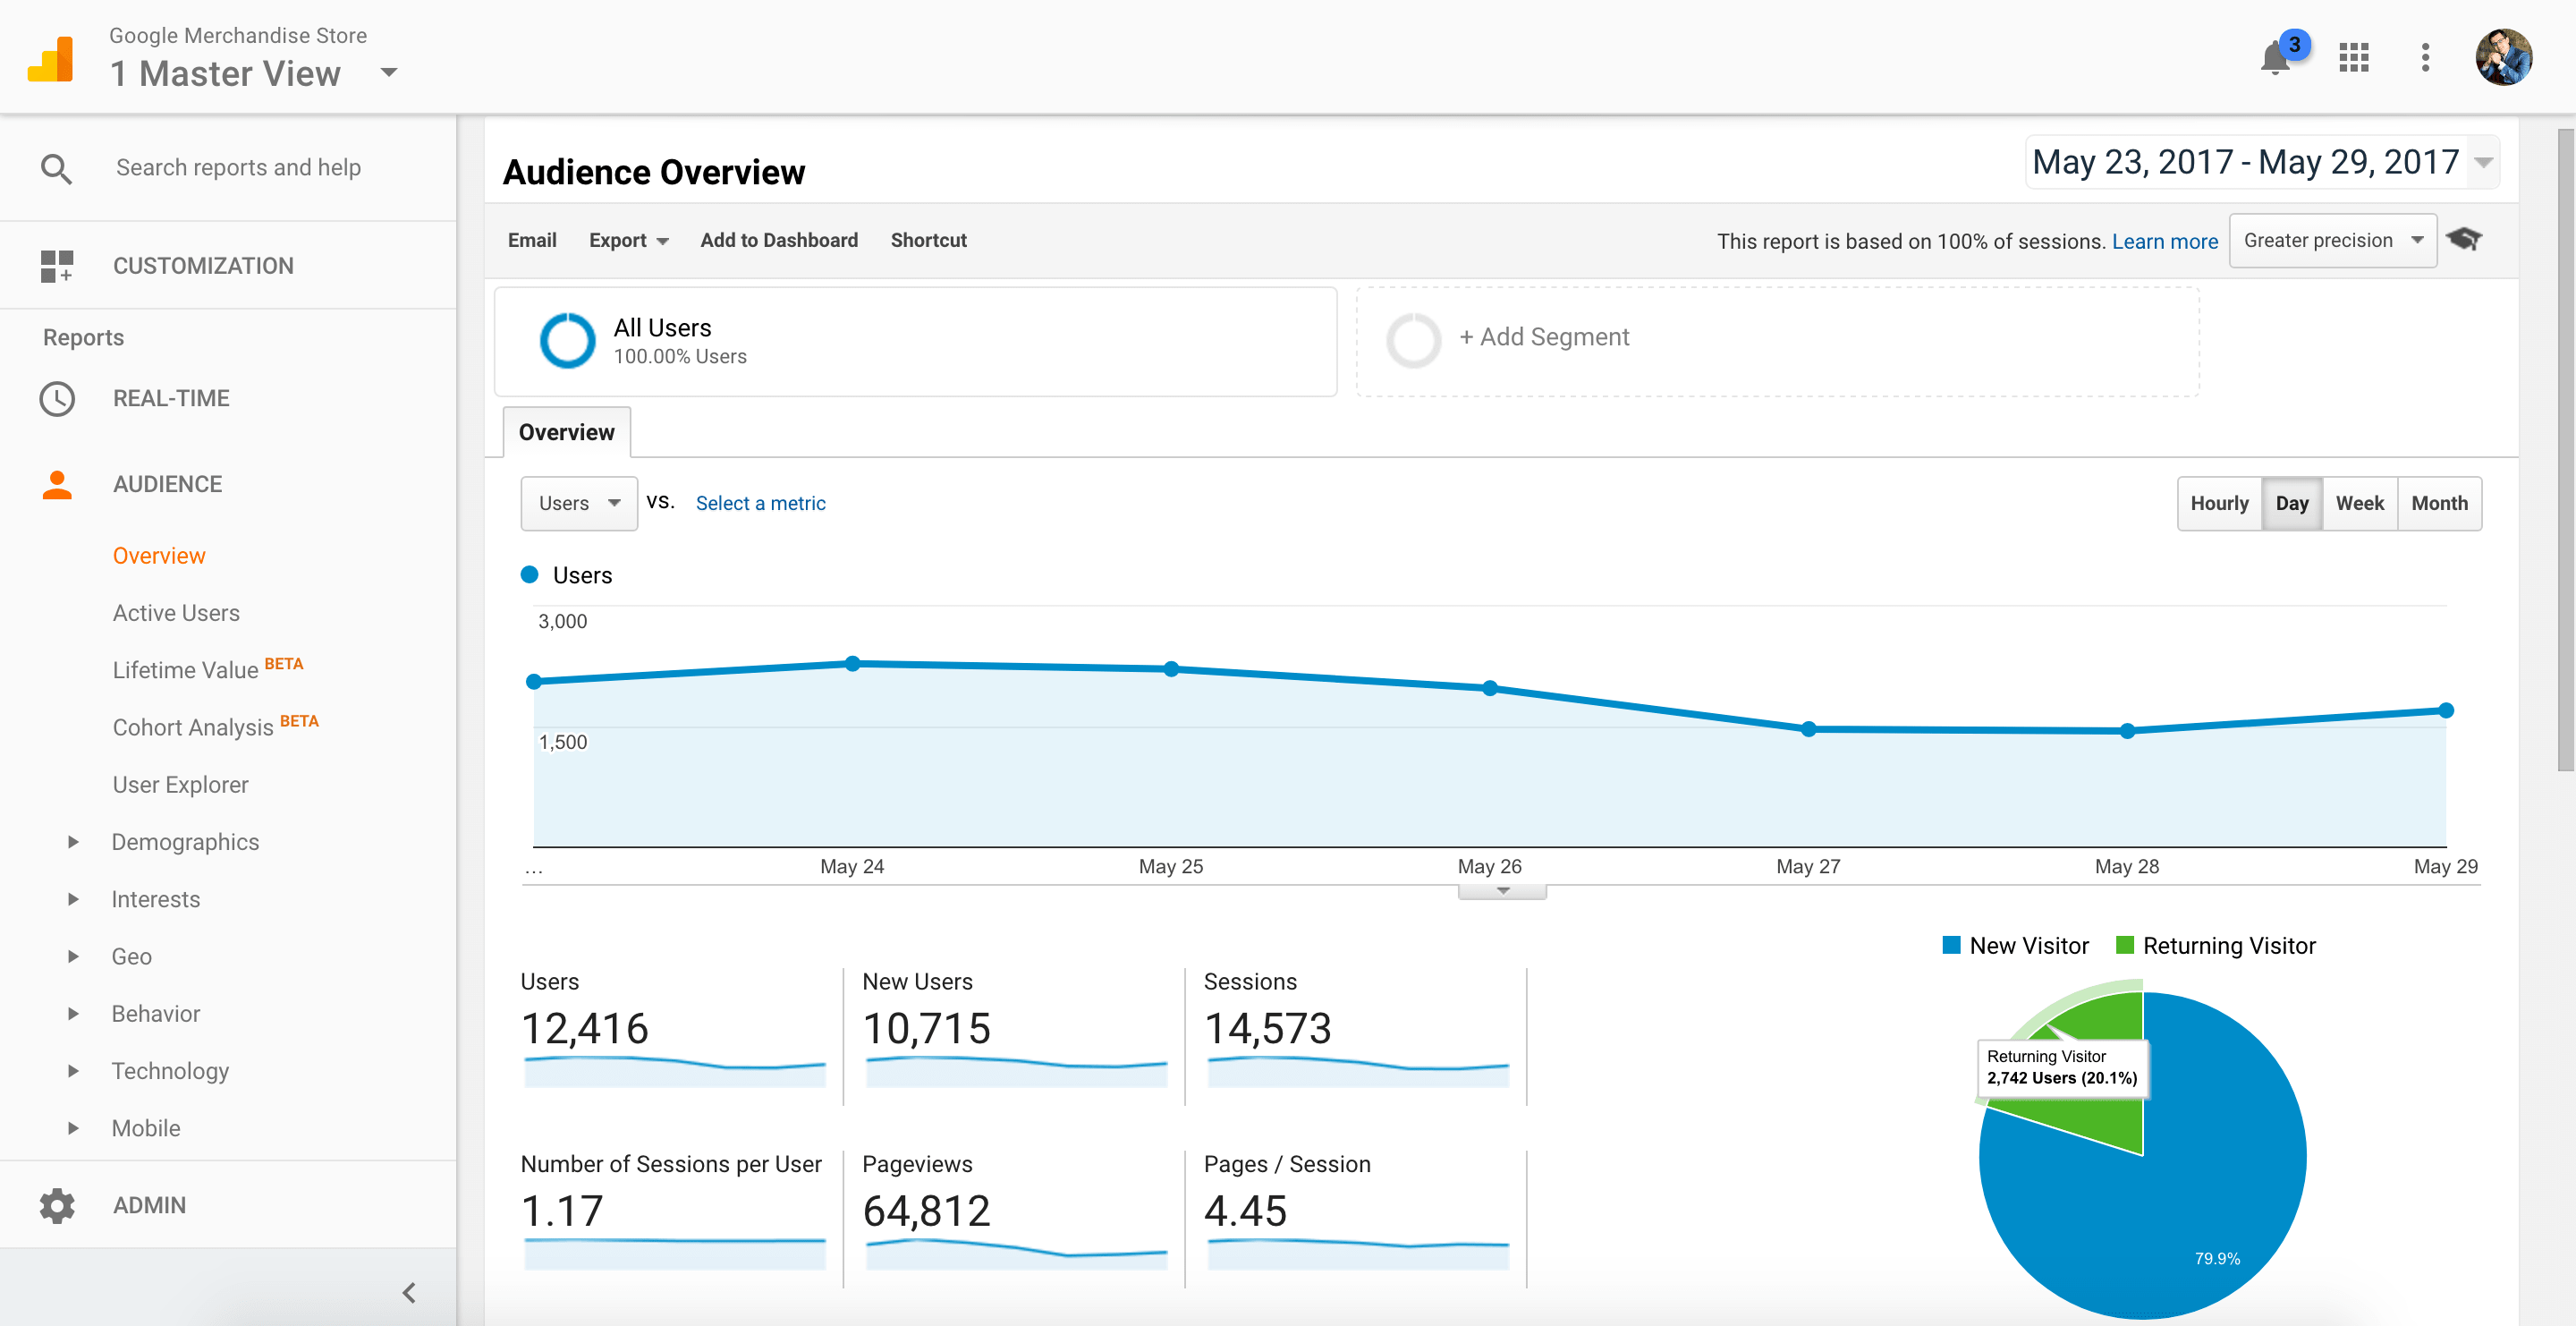
The Demo Account, using the Google Merchandise Store, is a great way for users to dive in and try out Google Analytics without having their site. It’s a fully functioning E-commerce store with all the integrations set up (AdWords, DoubleClick, Search Console, etc.) and gives marketers and students an excellent resource to dig into learning with.
Krista Seiden – http://www.kristaseiden.com/
Often people aren’t sure what are the benefits of implementing a particular set of features. Using the GA demo account, you can see what enhanced E-commerce reports, for example, look like with fully populated data. You are then able to make a decision as to whether you want to invest resources into the additional tagging work required.
Vinoaj Vijeyakumaar – https://www.sparkline.com/
The data in the demo account comes from a real E-commerce store, the Google Merchandize Store. Data coming from a real account is great because you have access to real data, especially E-commerce data, which is something hard to get when you want to have a sandbox account with which you can experiment.
Because the account contains real data you can use it to:
- Learn more about how Google Analytics works and interpret data.
- Use it as a tool to demonstrate Google Analytics and create learning materials for your students, if you are teaching others how to use Google Analytics.
- See enhanced E-commerce reports.
- View data from integrations such as Google AdWords or Search Console.
- Change reports using filters, secondary dimensions or segments.
- Create dashboards and custom reports.
- See calculated metrics.
If you want to learn more about the benefits of the demo account and what else you can do with it, be sure to check out this article from Emily Rosche (LunaMetrics) and this article from Michelle Noonan (Seer Interactive).
To get access to the Google Analytics demo account, all you need to do is click this URL.
Once you do that, you will be prompted to log in, if you already have a Google Analytics account you will be given access to the demo account.
If you do not have an account, then you will be prompted to create one, and then the demo account will be added to your new Google Analytics account.
5. User Explorer Reporting
The User Explorer report is a recently added report that allows you to see data at the user level.
Before this feature, the only way you could explore the activities of an individual (anonymized) user was if you had Google Analytics 360 and had hit-level data being imported into Google BigQuery. Now Google Analytics Standard users are also able to explore the activities of individual users to optimize your UX for certain cohorts of users.
Vinoaj Vijeyakumaar – https://www.sparkline.com/
In most of the Google Analytics reports you will see only aggregate data and this is the first report that drills down at the user level.
The user level reporting can be especially helpful when you identify issues with a segment of your users and want to investigate further. For example, you may have users coming from a particular source or using a mobile device that have a high bounce rate or that do not convert very well. By looking at a few individual reports, you may be able to identify the issue and fix it.
Another use case of this would be to take a closer look at your customers to see what they are doing right on your website and what you can do to make more people follow the same path to conversion. Or how you can help them convert faster.
Then, you can review what information you can change to see how you can get more conversions faster.
To view the User Explorer report navigate to Reports > Audience > User Explorer.
Initially, you will see data by Client ID, which consists of a random number and the first time stamp, attributed for every unique hit. If the same visitor does subsequent hits, then the same Client ID will be set.
However, please note that this works very well as long as the users do not block their cookies, clear their cookies or change devices.
To make this work across devices, you can implement User ID, which can identify users that log in to your site across devices and even if they clear cookies.
Using a User ID can lead to more accurate data because those users will be tracked across multiple devices as long as they log in.
If you would like to read more about Client ID and User ID, here you can read more about the difference between them, as well as get more information about the data collection, processing, and reporting.
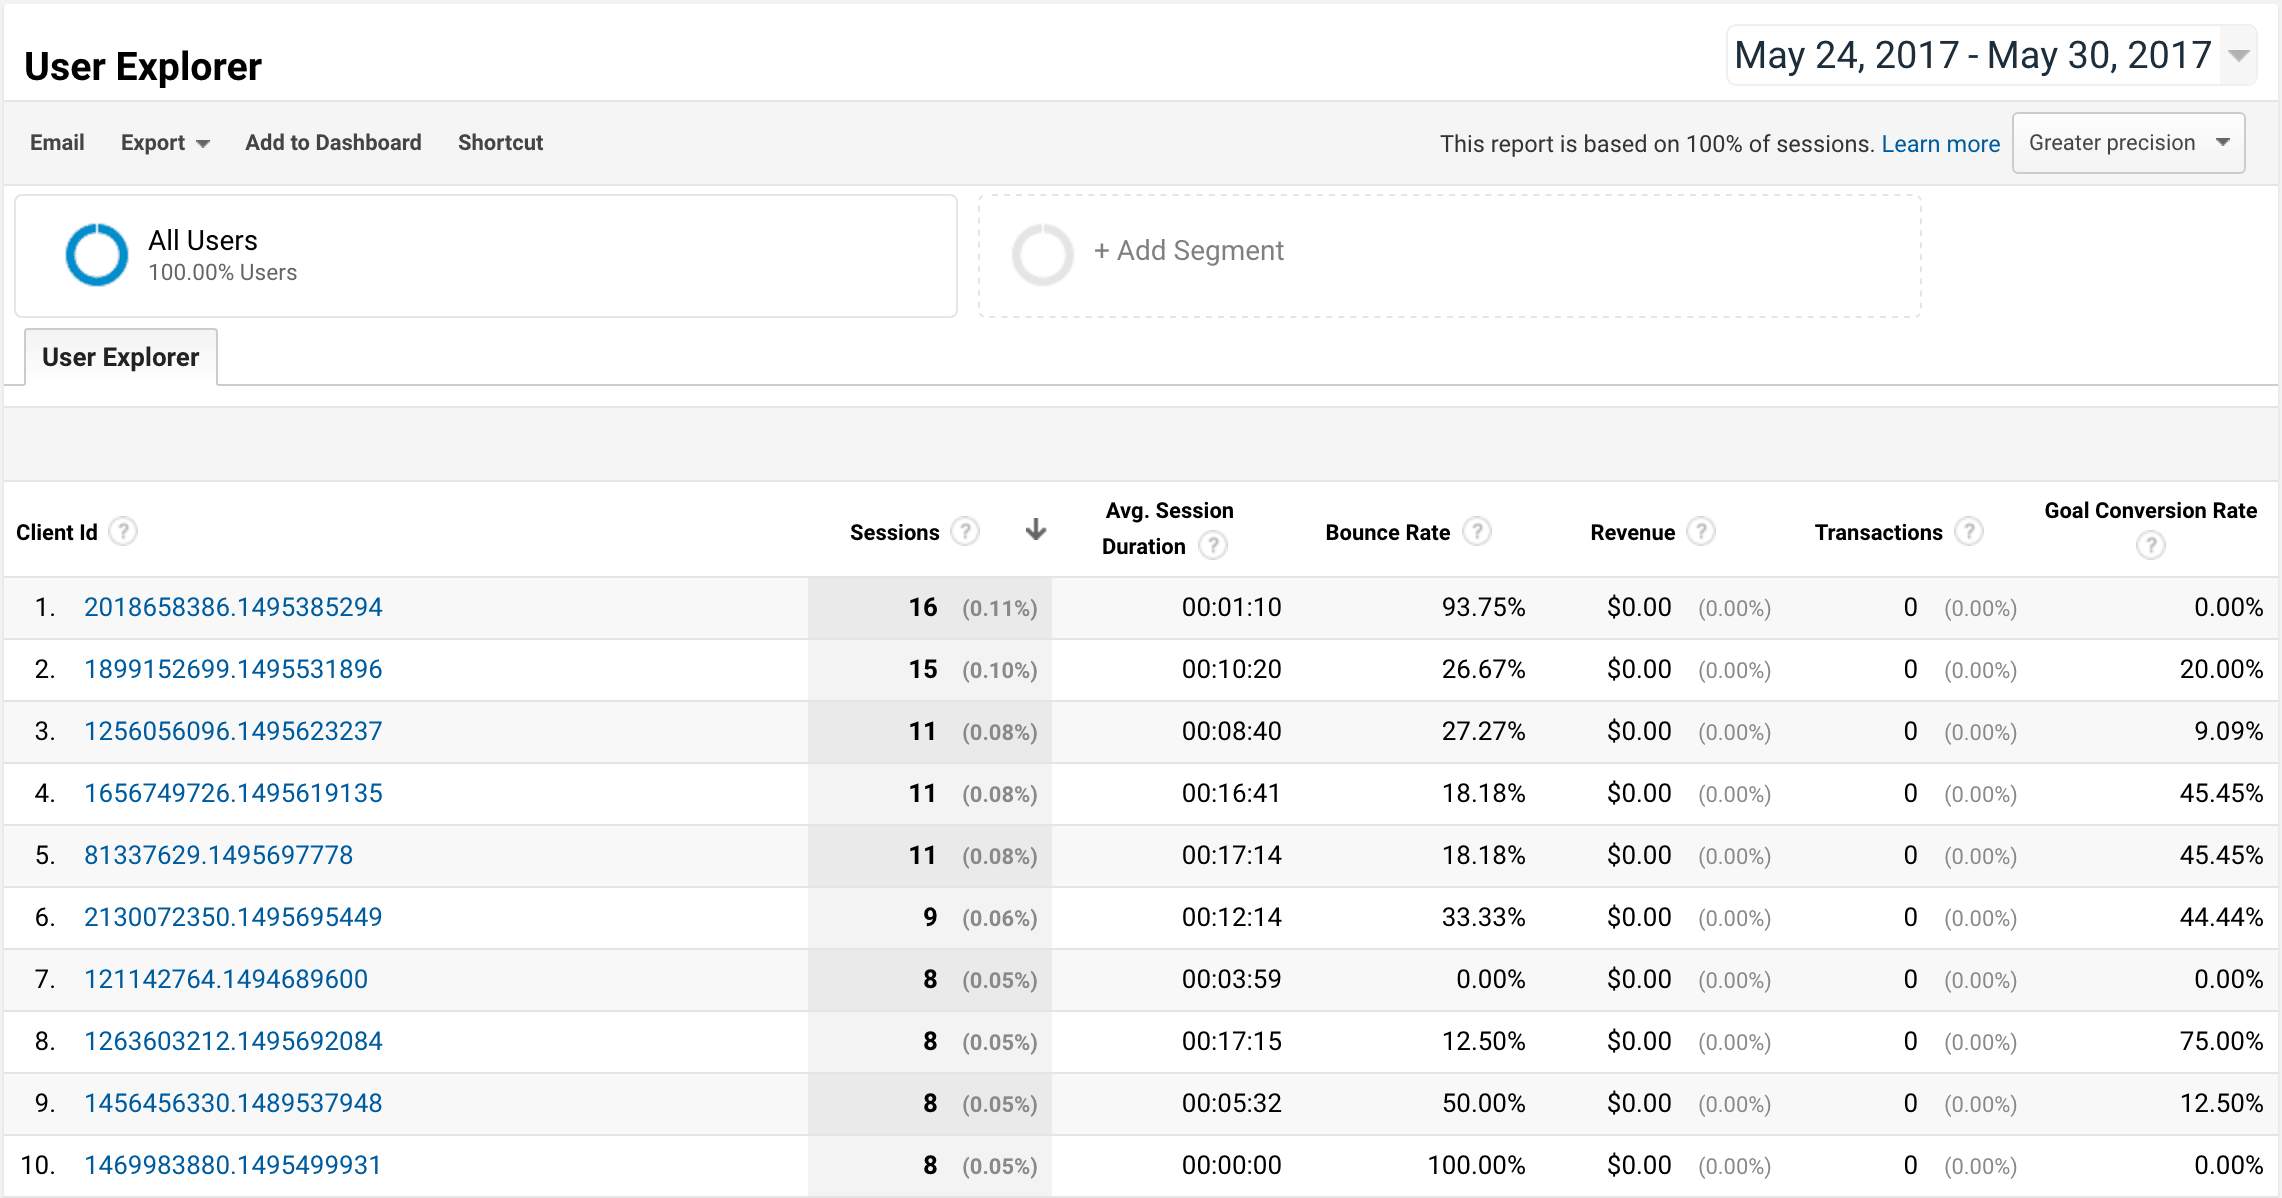
For each client or user ID, you see the following initial data:
- Sessions
- Avg. Session Duration
- Bounce Rate
- Revenue
- Transactions
- Goal Conversion Rate
Then, once you click on a client or user ID, you will be able to view an individual report for that ID, which contains the activity log, acquisition date, and channel.
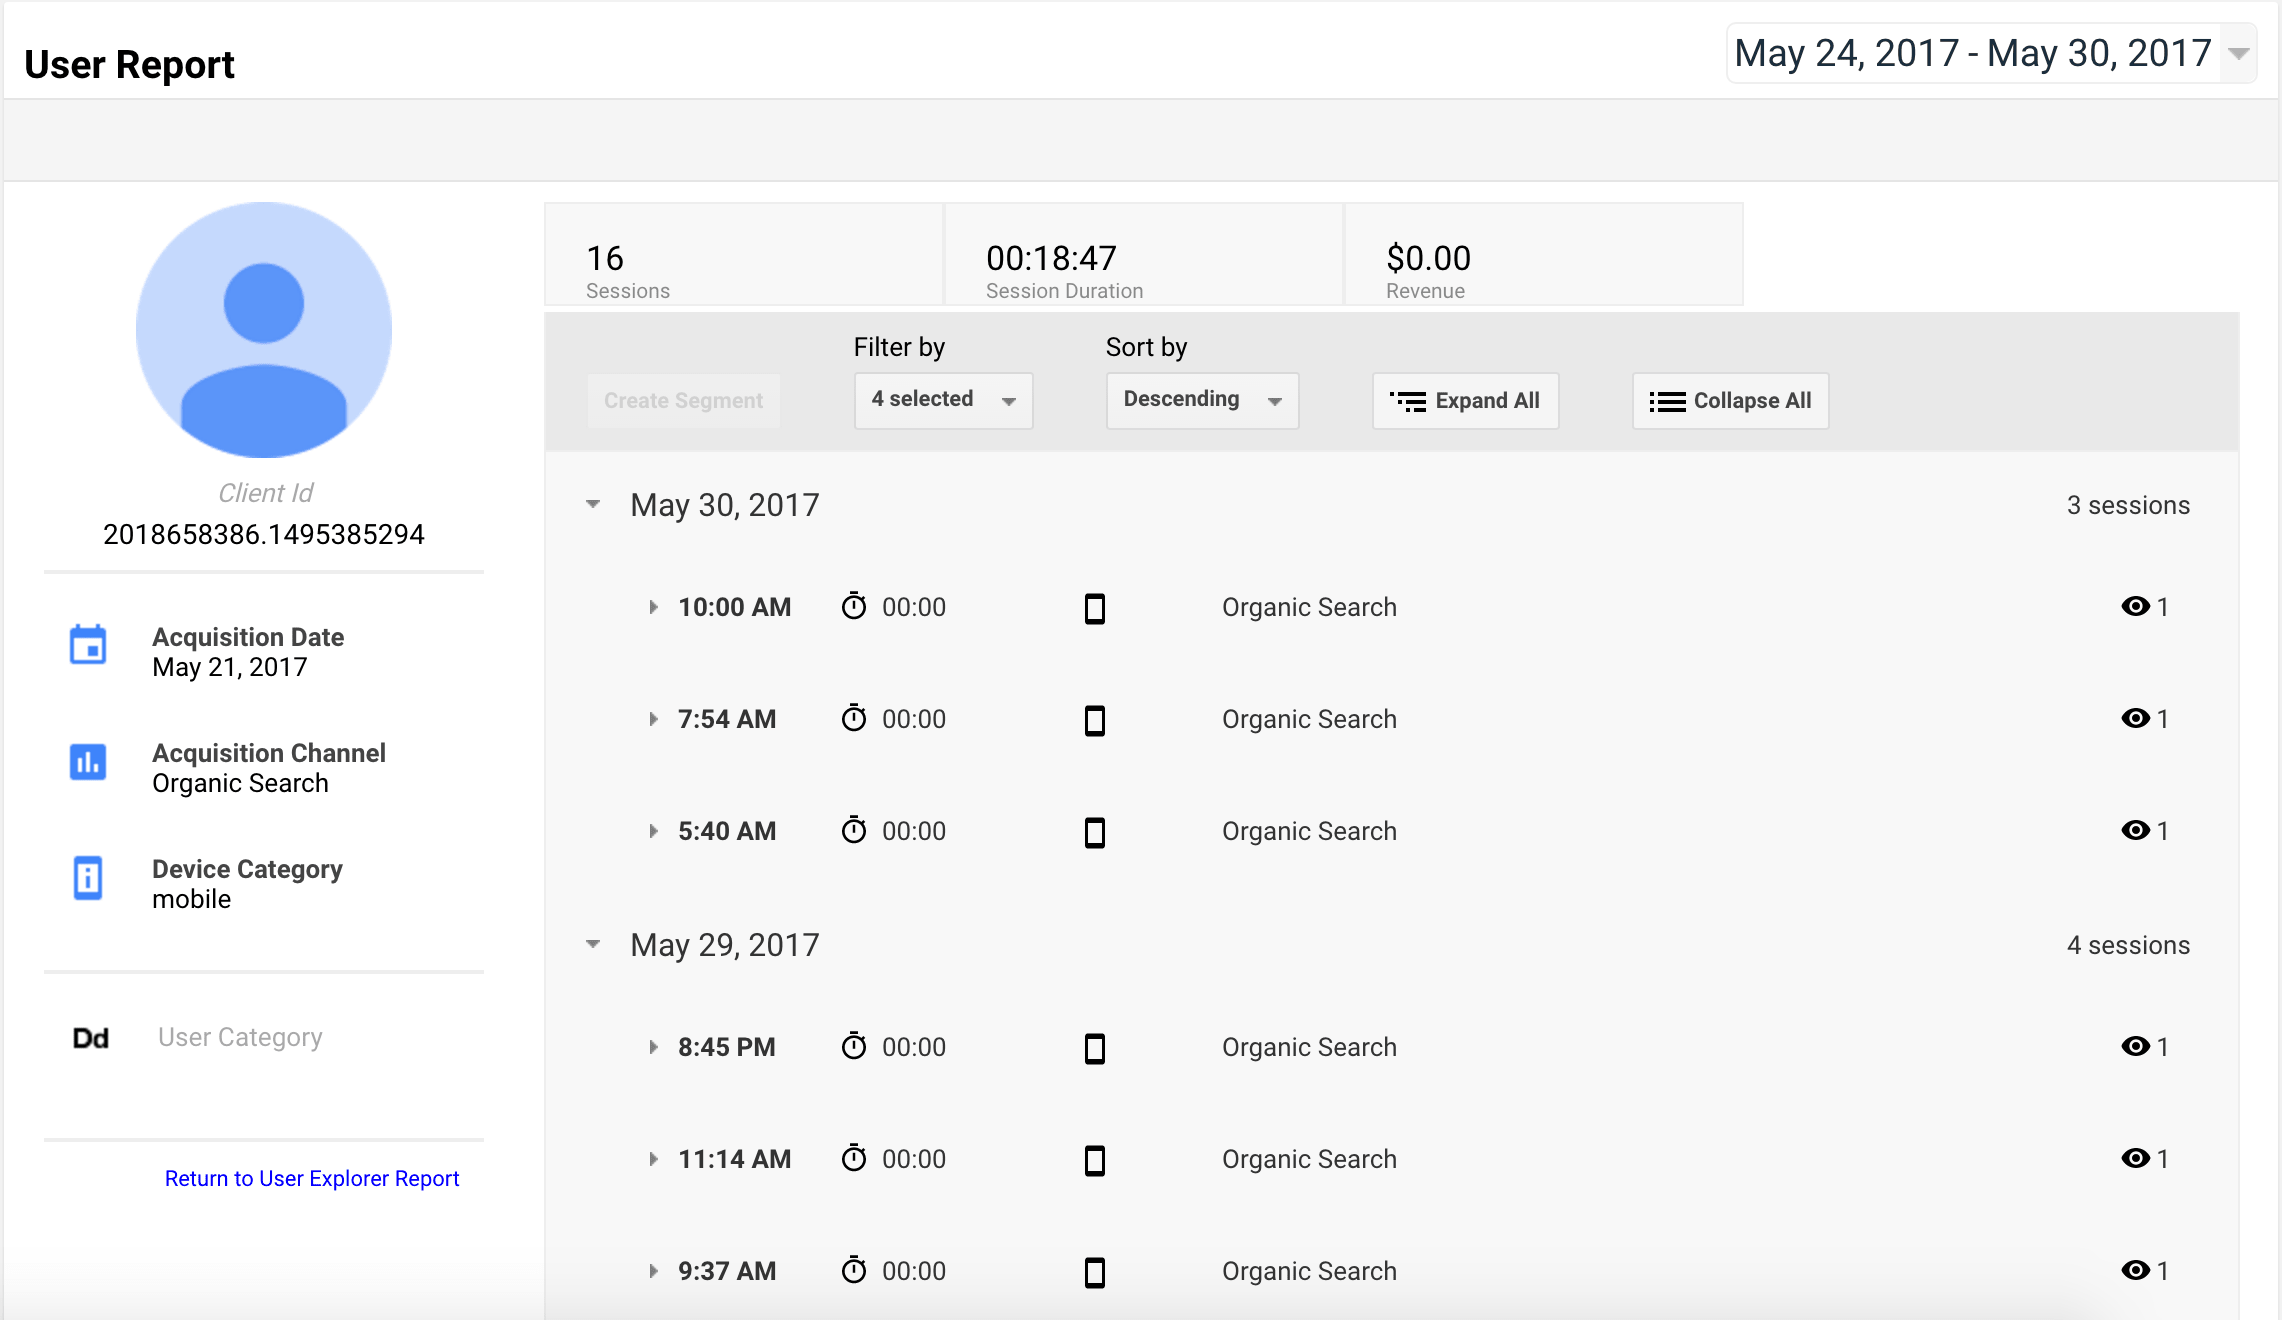
You will also see data for:
- Sessions (LTV): Total sessions over the user’s lifetime
- Session Duration (LTV): Average session duration over the user’s lifetime
- Revenue (LTV): Total revenue over the user’s lifetime
- Transactions (LTV): Total transactions over the user’s lifetime
Finally, here you can read more about the User Explorer report from Paul Koks (Online Metrics).
6. Custom Funnels (Google Analytics 360)
Of all of the reporting features that Google Analytics 360 has launched in the past few years, I think Custom Funnels are, quite possibly, my favorite. This report fills a significant need for analysts who are used to the traditional goal funnels in Google Analytics
Krista Seiden – http://www.kristaseiden.com/
Here you can find some of the benefits of Custom Funnels:
- Define steps based on any dimension criteria. With Custom Funnels you can build funnels on the fly based on events, page views, etc. There are no limits now to just using a page URL as a funnel step, which is the way it works with regular Google Analytics goals.
- They are retroactive! Unlike the Goal funnel visualizations which allows you to start viewing data from the day you create the goal and set up the funnel, you can create Custom Funnels to analyze your user behavior during any period you choose.
- Create a new segment from a drop-off point and remarket to that audience with AdWords or use that audience to target a test variation in Optimize 360.
If you are using the Measurement Protocol for offline data import or looking at cross-device tracking with a user ID, this can be an especially awesome way of building a complete picture of your full funnel or customer journey.
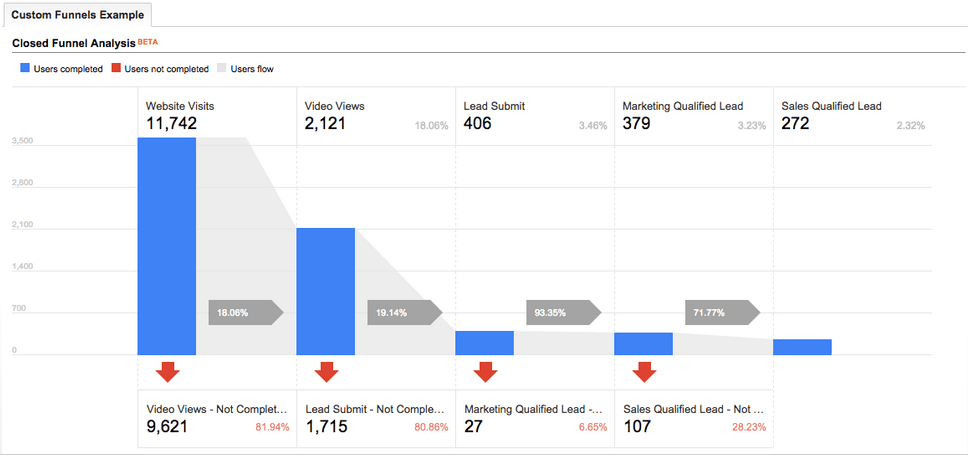
For example, the first screenshot shows what a funnel would look like with just your online data:
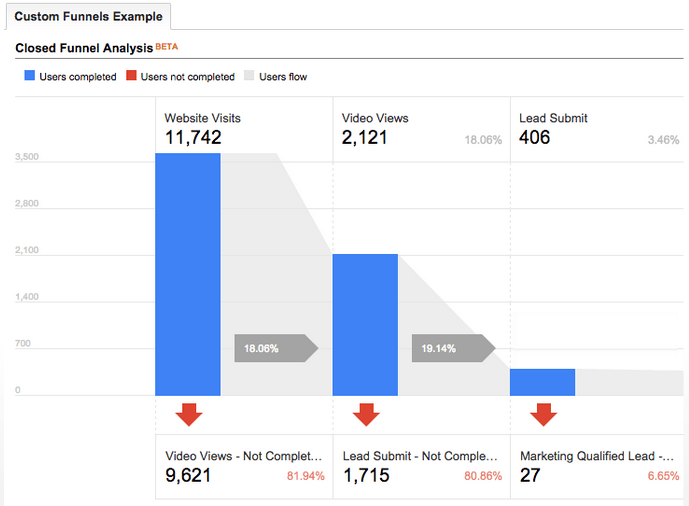
When using an offline system, such as a CRM, you are no longer able to track leads once they leave your website.
However, you can use Measurement Protocol to send hits to Google Analytics and then you can use them as steps in your Custom Funnel:
7. Data Studio
Data Studio is a new tool that will help you visualize Google Analytics data, along with data from other sources in a way that is much easier to understand.
The newest feature in GA I am most excited about is the data studio product. Why? Because for years I have been frustrated with the way classic dashboards work in Google Analytics. They were rigid, limited, and didn’t give much of an option for making changes.
Sure, you could look at sales for your E-commerce store, or top pages visited from social, but you couldn’t tell a narrative. You couldn’t get a pulse on your business. If your data was incorrect, you couldn’t change it. Doing much of anything with these dashboards was difficult. You couldn’t introduce your data sources, you had to have perfect data and configuration, and even then reports were severely limited.
You needed a third-party product to do anything with your Google Analytics data. That is before they released data studio. Data Studio solves all the pain points I mention above, and introduces new opportunities that were previously reserved for our “wish list of things that might happen someday.”
The year 2016 became someday with Data Studio, and that is why I’m so excited.
Jeff Sauer – https://www.jeffalytics.com/
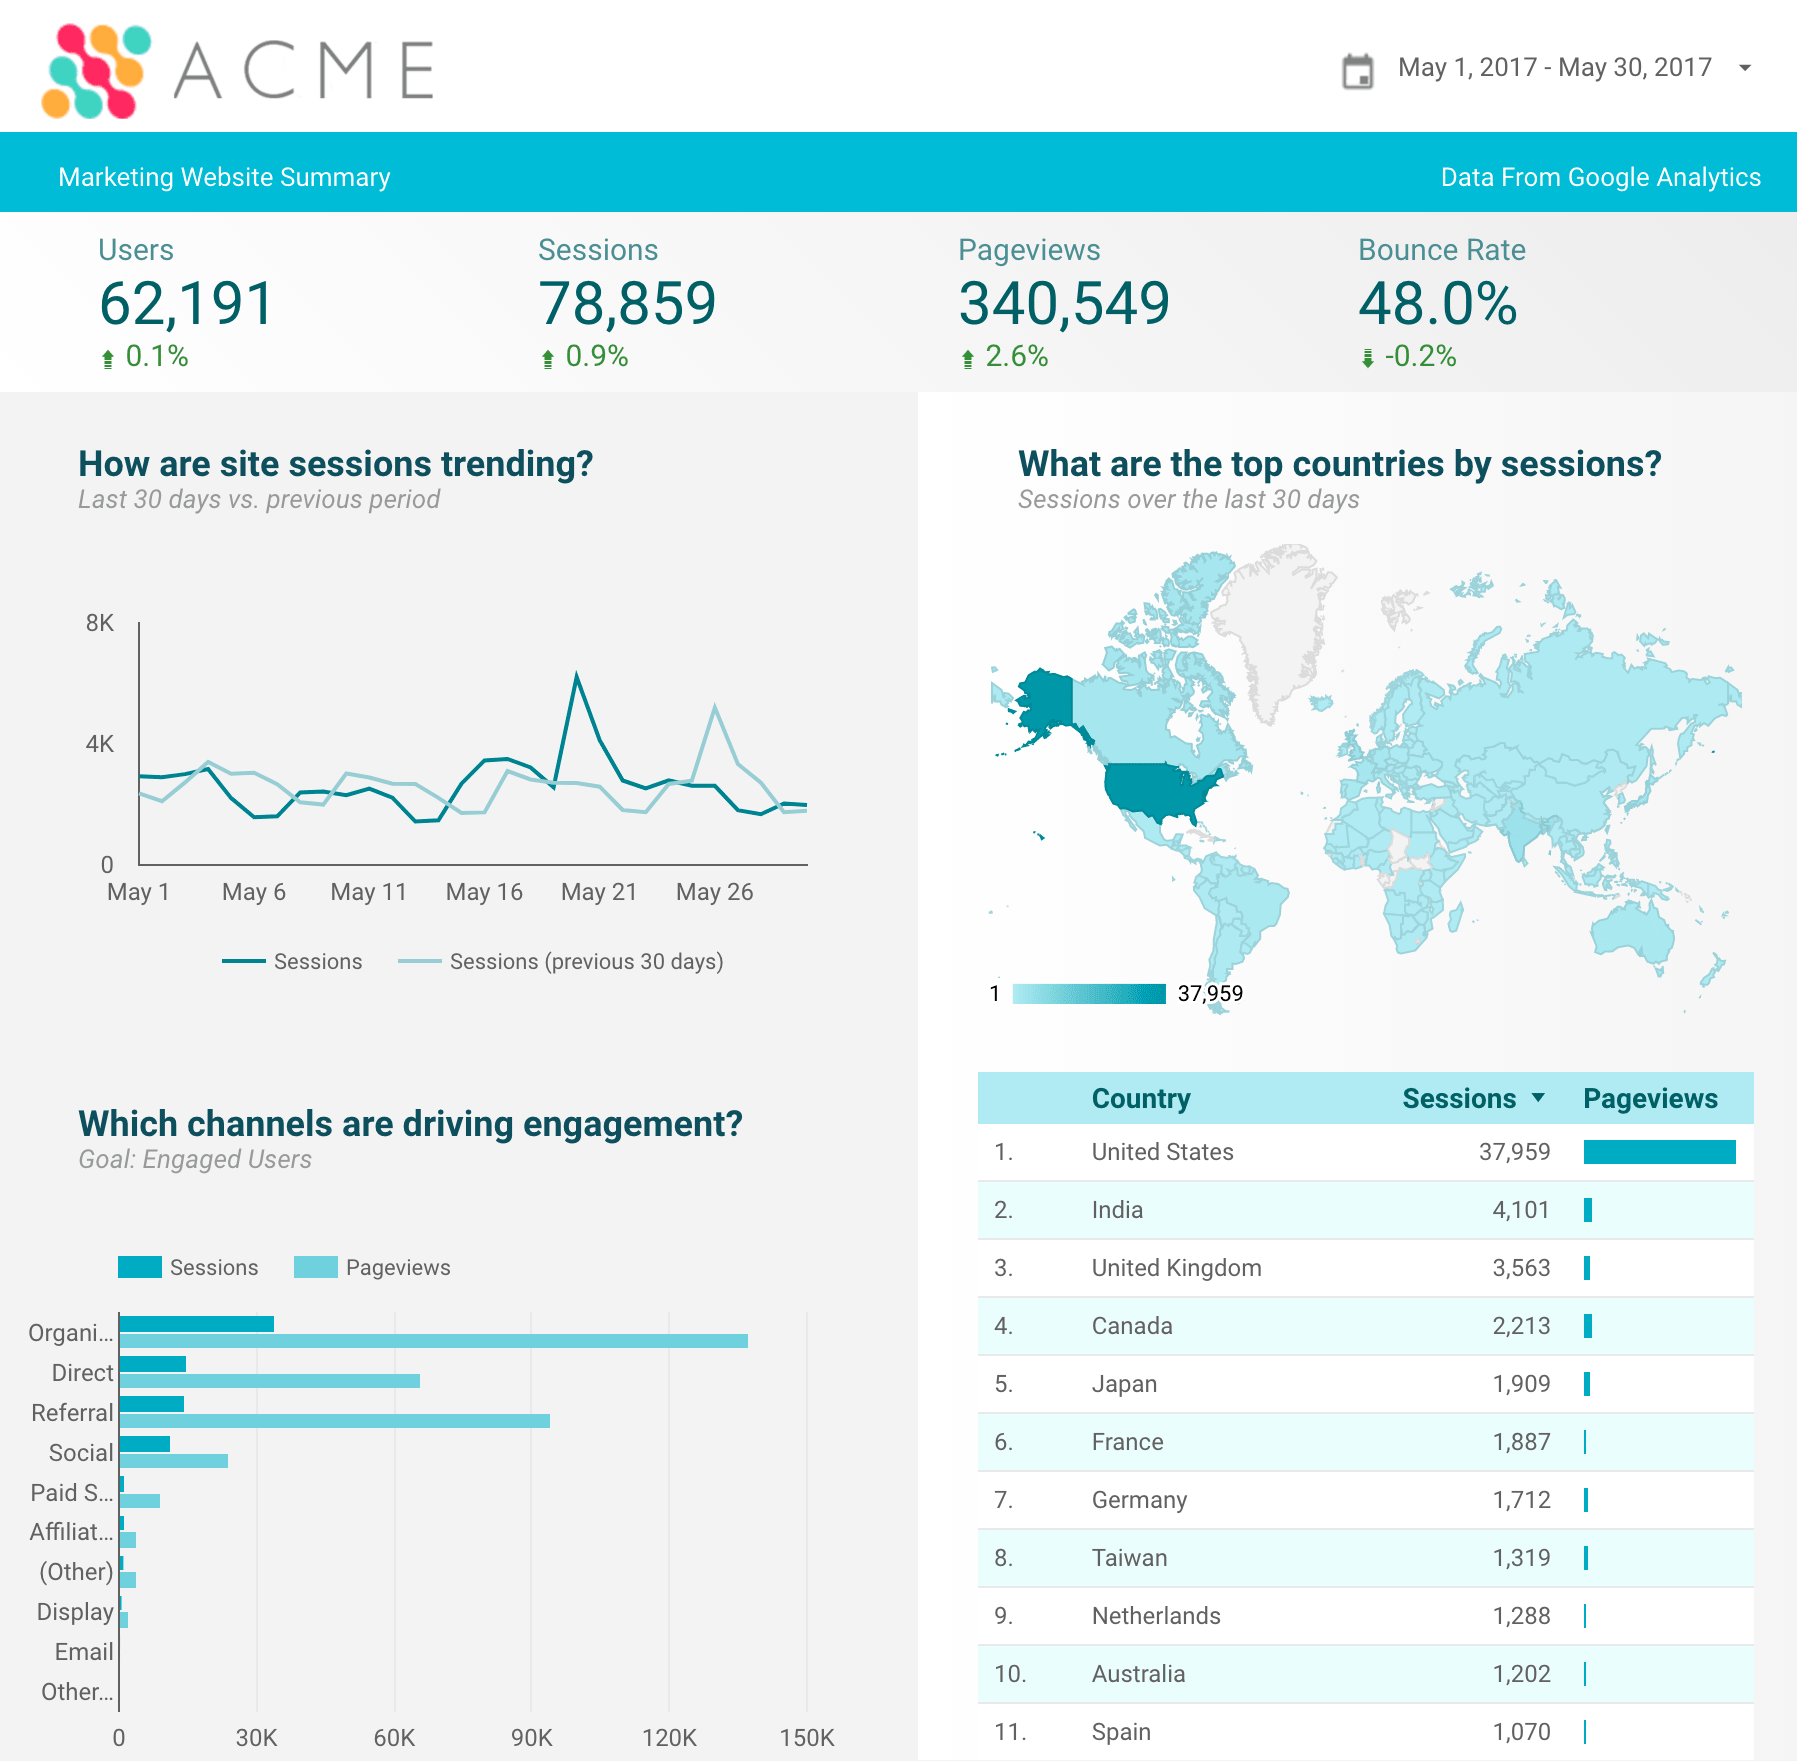
With Data Studio you can connect multiple data sources like Google Analytics, Search Console, YouTube, AdWords, Google Sheets, upload custom documents and more.
Once you connect data sources, you can add to your report and customize bar charts, pie charts, time series, bullet charts or heat maps.
Then, when your report is ready, you can share it with your team, clients or management.
For an in-depth review of Data Studio, you can check out this article from Daniel Waisberg (Online Behavior).
Recap
If you want to be up to date with the latest Google Analytics features and make the most of them, you need to look at:
- Calculated Metrics
- Integration with Search Console
- Property Moving
- Google Analytics Demo Account
- User Explorer Reporting
- Custom Funnels
- Data Studio
Your Turn
Now that you’ve seen the new and most exciting Google Analytics features from top Google Analytics experts, I would love to hear what your preferred Google Analytics features are?
Also, let me know if there is anything we missed and should have included in the article.
It is really a great and useful piece of info. I’m glad that you shared this helpful info with us. Please keep us informed like this. Thank you for sharing.
Great article, also this post should have more comments.
Datastudio is a powerful tool to create outstanding marketing reports. If only Google added the feature to report on even shorter timeframes, hourly for example…