Earlier this year Google announced a new interface for Google Analytics and made it available for everyone on the 20th of April.
You may have read about this on the Google Analytics Blog or on other blogs that are talking about the new Google Analytics v5, but with this article I want to share with you 14 awesome features that I love in the new version of Google Analytics. Features that I am sure you will love too once you see how powerful they are.
But before we get started, I just want to make sure that you are using the latest version of Google Analytics. If you are not, just login into your Google Analytics account and click on the [New Version] link from the top right corner of your account.
Now, take some time to check your Home screen and find your way around. As you can see the Home screen displays now only links to your profile(s) and not the dashboard anymore.
Once you are all set, make yourself comfortable and check the new features of Google Analytics v5 that you will love by the end of this article.
If you are a video fan make sure you also check this video overview created by the Google Analytics team which presents some of the features included below.
Another thing that we should discuss before diving into those specific features is the menu, which has also been changed in the new Google Analytics version. Right now, the menu contains 5 items:
- Home – displays a list with your available profiles
- Dashboards – from here you can visualize your Custom Dashboards, a feature which I will cover below
- My Site – contains all your Reports and Intelligence Events
- My Conversions – contains your Goals, Ecommerce and Multi-channel Funnels
- Custom Reports – allows you to create and visualize Custom Reports
Now, let’s dive into the new Google Analytics v5 features.
1. Multi-channel funnels
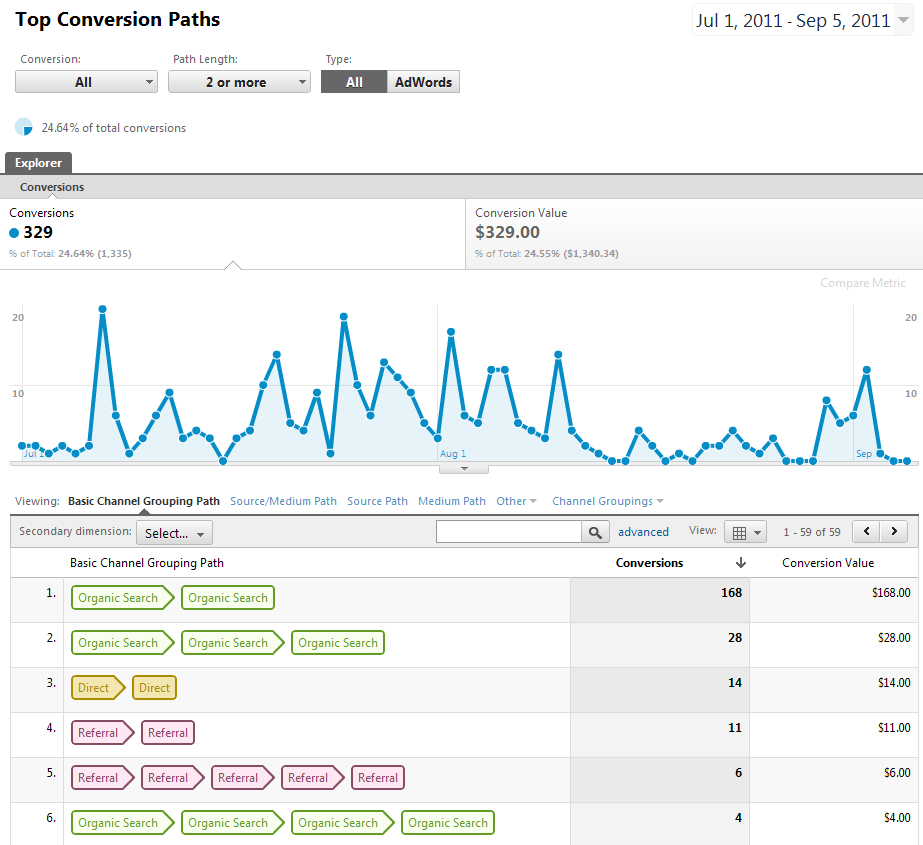
On top of my list is the Multi-channel funnels, which provides powerful insights about the path that a visitor took before converting, over a period of 30 days.
Before this, when someone converted as a customer or subscribed to a newsletter, the last link that the visitor clicked was credited for the conversion. But now, the new Google Analytics lets you see what other mediums (organic, ads, social networks, referrals) your visitors used to reach your website before converting.
This way you are able to see hidden channels that have contributed to your conversions and get additional insights about which channel is worth leveraging more.
To check the Multi-channel Funnels feature, just hover your mouse over [My Conversions] and select [Multi-channel Funnels]. All you have to do is just have goals created or e-commerce tracking enabled. In case you are not sure how to create goals, I am covering this in one of the Google Analytics course lessons.
Starting with September 1st data is available in the Multi-channel Funnels since January 2011.
To see exactly what I am talking about and why this is so important when measuring conversions please also check this video:
2. Multiple and Customizable Dashboards
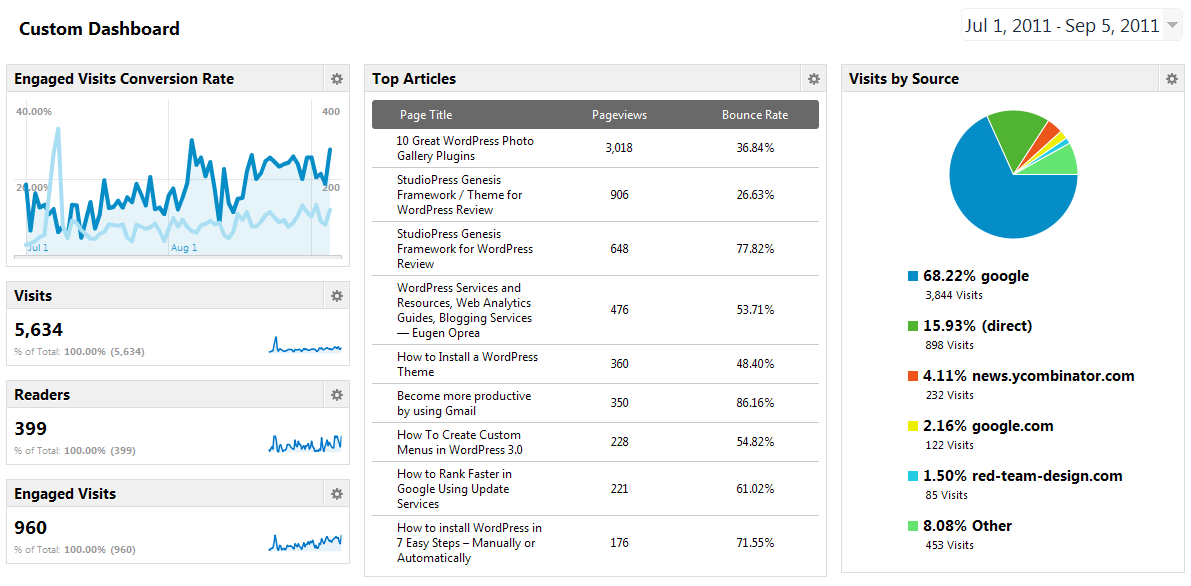
If previously you had access to only one default dashboard, now you have the freedom to create up to 20 dashboards per profile, the way you like them.
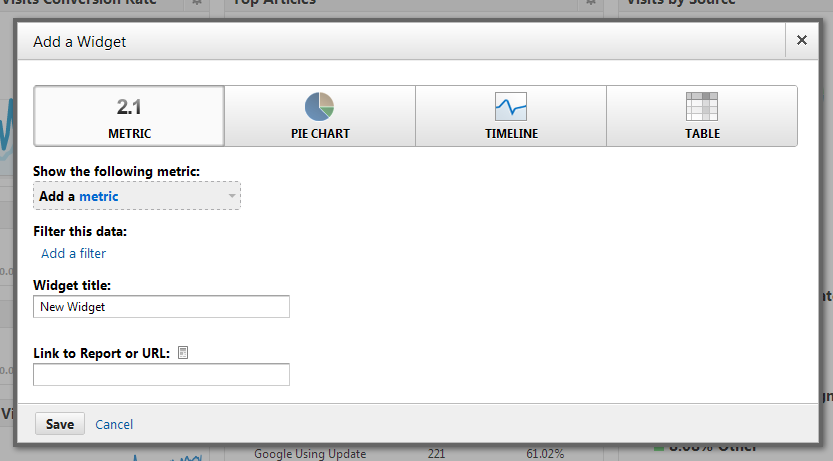
The newly designed user interface contains slick widgets which can be dragged and dropped in order for you to easier build your own dashboards. The new Google Analytics allows you to choose from 4 types of widgets: Metric, Pie Chart, Timeline, and Table. Using them, you can easily create your customized dashboards to get more insights from your Analytics data.
To create your first dashboard, just select [Dashboards] from the top menu and [+ New Dashboard]. First you will have to choose a name for your dashboard and then add widgets to it. Each widget can give you different insights from your data, so be sure you check all of them:
- Metric. This widget displays the value of a metric and a sparkline for your selected time period (e.g. Visitors)
- Pie Chart. The Pie Chart breaks down a metric by certain dimension (e.g. displays visitors by source)
- Timeline. The Timeline displays a chart of your selected metric for a selected period of time. Additionally, that metric can be compared with a second one (e.g. Visitors compared with the Conversion Rate)
- Table. This widget displays tabular data for one dimension. You can choose to display up to 10 rows and 2 metrics
To start off, check my dashboard above and try to duplicate it. Next, create your own dashboard with the metrics that matter to you.
I will share more customized dashboards in one of the Google Analytics lessons, so make sure you are subscribed.
3. Events Goals
Events allow you to measure who pauses or fast forward on a video, who clicks an ad, who downloads an eBook or how many errors a visitor encounters during the checkout.
I personally use events to measure who clicks on my sidebar ads and who closes or subscribes to my Google Analytics course using the pop-up form.
To do that, you have to add onclick=”_gaq.push([‘_trackEvent’, ‘category’, ‘action’, ‘opt_label’, ‘opt_value’]);” next to your URL, just like in the example below:
< a href=”https://eugenoprea.com/genesis/” onclick=”_gaq.push([‘_trackEvent’, ‘Ads’, ‘Sidebar’, ‘Genesis’]);” >
But what is more insightful about Events in the new Google Analytics version is the fact that you can add an event as a goal.
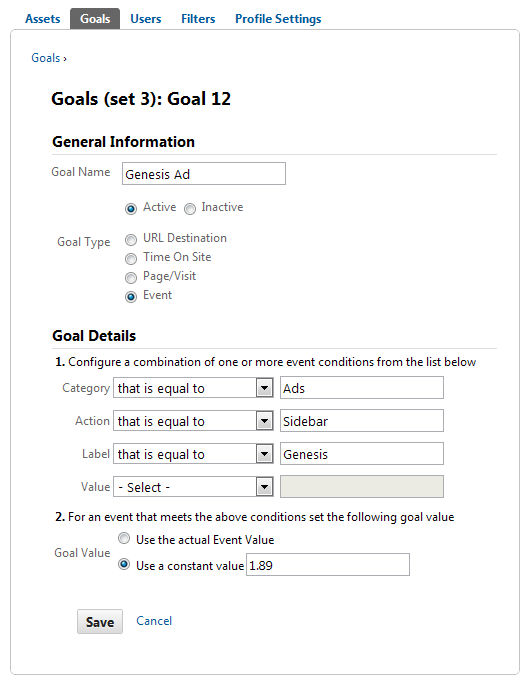
To setup goals for your events, you need to add a new goal, enter it’s name and choose [Event] as a Goal Type. Then, you need to fill in it’s Category, Action, Label, and Value. For our example the Category is “Ads”, Action “Sidebar” and Label “Genesis”. I haven’t added a Value, because I use Goal Value to track it’s performance.
Here is how the above example looks into my Google Analytics account:
4. Plot Rows
At this moment the top charts from the Google Analytics reports display information over selected periods of time and they do their job very well.
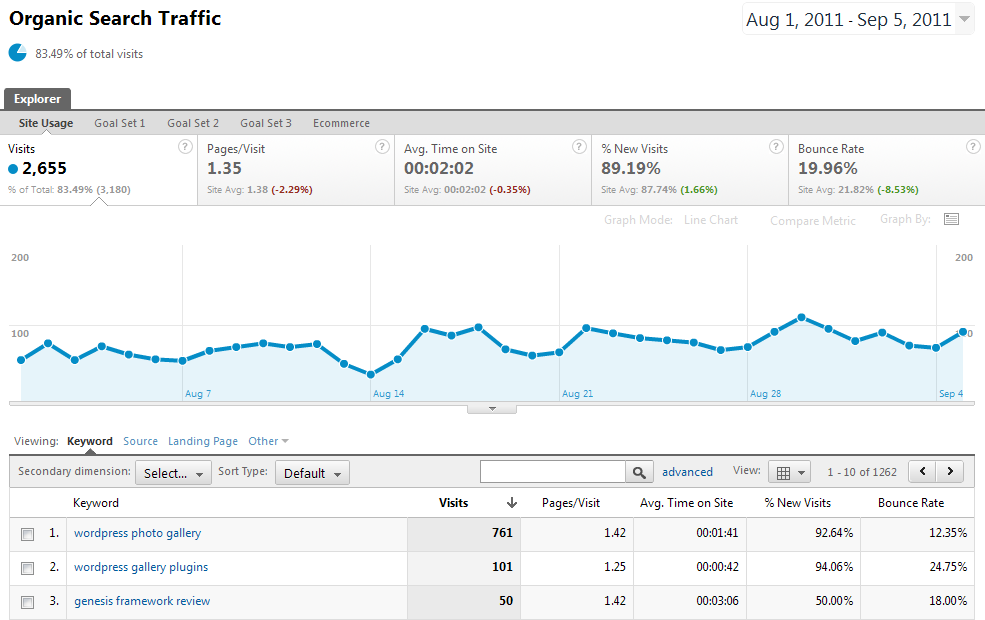
But with Plot Rows, you are able to select individual rows and create instant segments with those rows. This segments can show you how those rows compare with the totals of that report and with each other. Just like in the screen shot below:
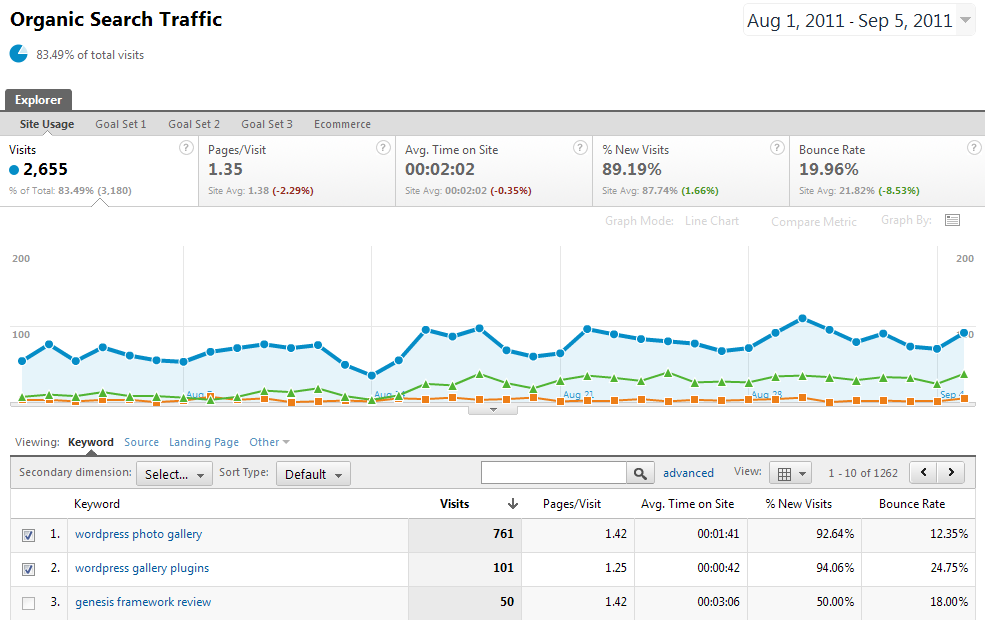
All you have to do to use Plot Rows, is just select 2 rows from any tabular report and select [Plot Rows] from the bottom of the report. In case you want to use Plot Rows into a report that has, say for example a pie chart, just switch to the [Data] view and use it.
To make the most out of it, try not to apply Plot Rows to compare metrics which have a big difference between them. For example, comparing a keyword with 1,000 visits out of 2,450 with one that has 90 visits is less insightful than comparing the same keyword with one that has 954 visits.
Video fan? Here is a a quick recording which shows you how Plot Rows works:
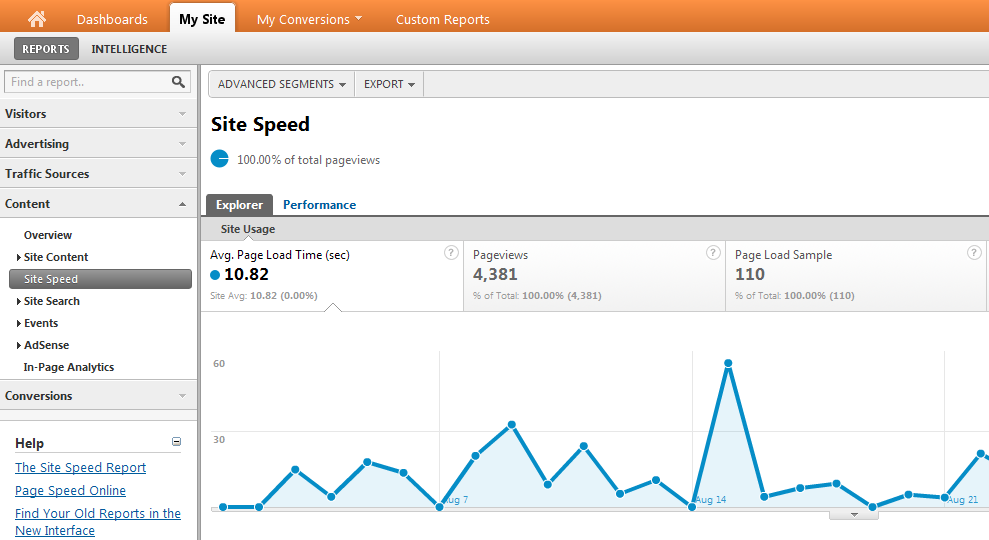
5. Site Speed Report
Search engines care about how fast your website is loading and they will let your site speed influence your rankings. For Google it’s official, a slow landing page will influence your AdWords Quality Score or your organic rankings.
However, they also influence your visitors retention and conversion rate, as no one will stay 30 seconds to wait for your site to load.
Those are just a few reasons why you should care about your site speed and why Google Analytics includes the Site Speed report into its newest version.
The page speed measurement will be automatically turned on and the Site Speed Report will start displaying information about the load time of your pages.
With the Site Speed Report you can see not only how fast your web pages load, but you can also check other dimensions. For example you can see what is the load speed of your pages by traffic source or check information about your visitors.
The Site Speed report can help you answer these questions:
- What pages of my site are slow?
- Which of my visitors browsers load my site slower?
- What regions experience a slower load speed?
- …and much more
6. Enhanced Analytics Intelligence
Intelligence gets better and better. You have now available in Google Analytics a new section called [Intelligence Events] with 4 new reports:
1. Overview
2. Daily Events
3. Weekly Events
4. Monthly Events
The Overview report displays an overview of your automatic alerts and custom alerts that you have created over time. Additionally, it lets you drill down and find new information about each alert.
Here, you can discover new insights about your alert, create annotations or display the full report.
To access the Intelligence Events Overview, hoover your mouse over [Reports] in the menu and click [Intelligence].
The Daily, Weekly and Monthly Events reports display information about your alerts grouped by day, week or month.
7. Improved Map Overlay
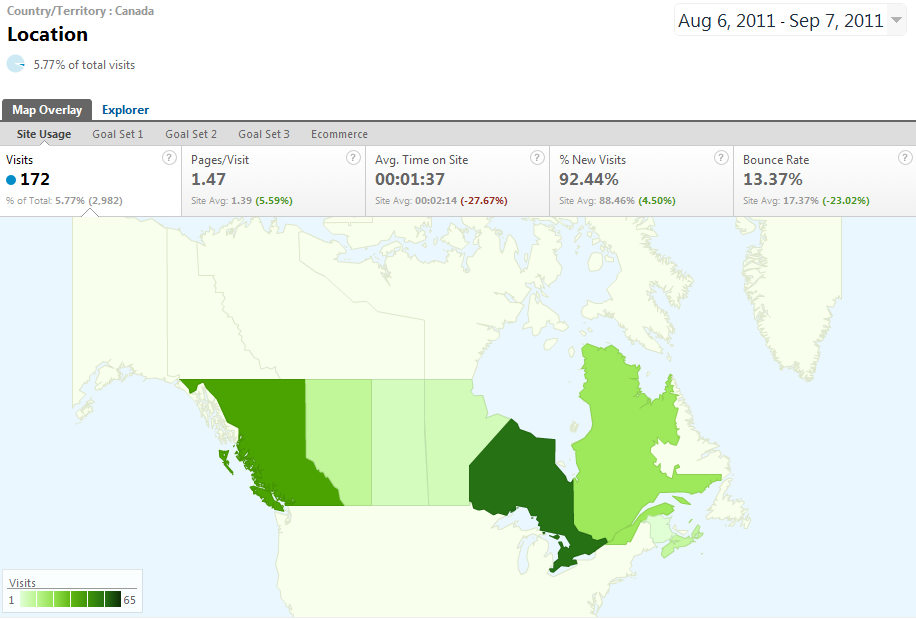
The new Google Analytics version has improved the Map Overlay reporting so your can see the traffic broken down into regions for over 170 countries. Before, you were able to do that only for the United States.
To access the Map Overlay report go to [Visitors] > [Demographics] > [Location] and check visitors information for your desired region.
8. Improved Custom Reports
In the new version of Google Analytics there is a whole new section for Custom Reports, which can be accessed from the main menu.
Custom Reports is one of the major changes that Google Analytics suffered in this version and you can create custom reports more easier now. Plus, they provide more insights.
One sweet enhancement is filter option, which lets you add a filter to your custom report. How this helps you? If you use filters a lot in the interactive report, you will really like this because you can save a custom report (similar with one you check frequently) and apply the filter straight to the custom report. It’s a huge time saver.
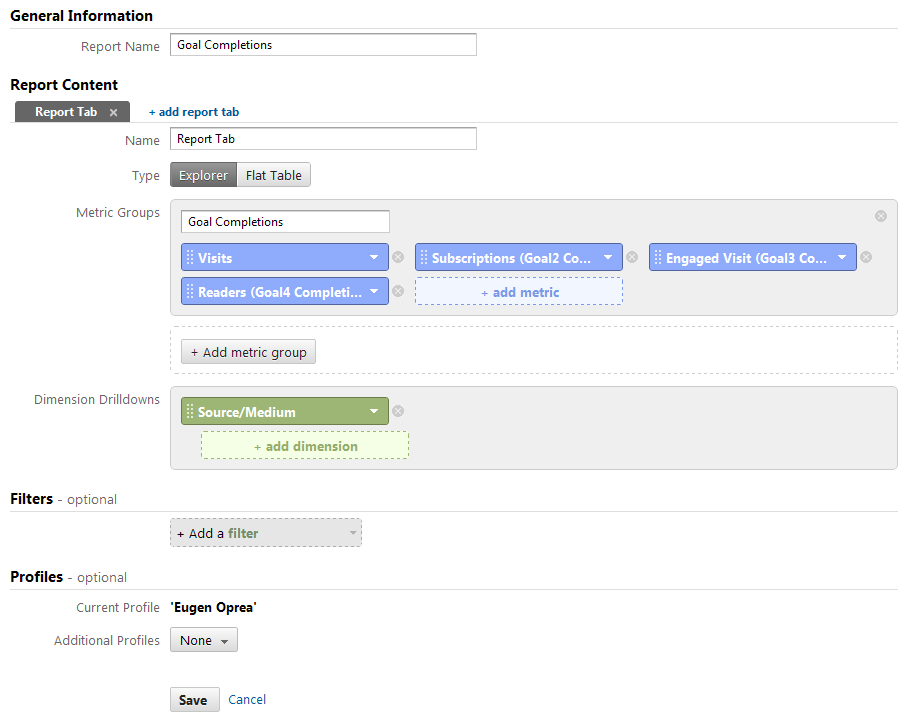
Another enhancement is the fact that you can add different dimension for different tabs, unlike the old version where you couldn’t add different dimensions, but only additional tabs. Plus, you can add metric groups, which helps you display plenty of metrics, but in and organized structure.
To start with custom reports, create a copy of the one you can see above and once you get familiar with the options, create your own customized report.
9. Improved Mobile Reporting
As you already know, mobile is the future and it’s very important to leverage this. Fortunately, Google Analytics comes in handy because it allows you to see which of your visitors are using mobile devices and not desktop PCs or laptops.
You have 2 reports to choose from in the [Visitors] > [Mobile] section: Overview and Devices. The Overview report displays how many visitors have used mobile devices and how many non-mobile devices.
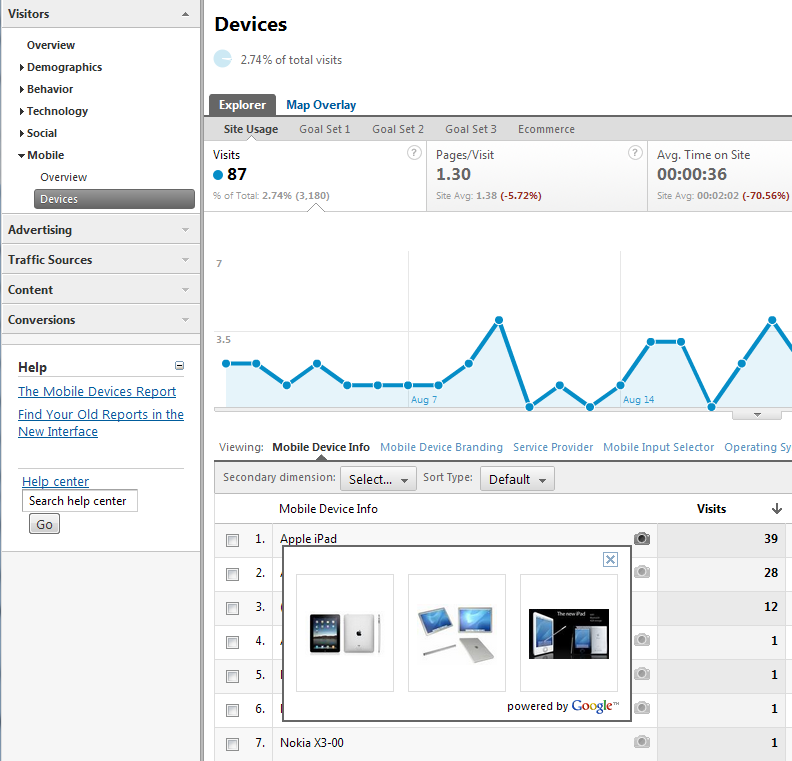
On the other hand, the Devices report displays the type of mobile devices that your visitors have used and you can even see a picture of them.
The Devices report has also multiple dimensions, which will let you see additional information about your mobile visitors, such as:
- Mobile Device Branding
- Service Provider
- Mobile Input Selector
- Operating System
To start with, this report can help you see whether you need a mobile version of your site or not. If you have a high Bounce Rate this means that your visitors cannot properly see the information they are looking for and they leave, so you definitely need to make a mobile version of your website.
10. Fast Profile Switching
In the new Google Analytics switching through different profiles has become a lot easier. Now, you can switch to a different profile on the exact report with the exact date range.
Moreover, if you have a large number of profiles you can search them in the search bar from the top right section. You can switch to a different profile by finding it into that list or simple strat typing its name.
11. Bookmark Anything
Another sweet enhancement of the new Google Analytics v5 is that you can bookmark anything. Any page you visit in Google Analytics can be bookmarked and saved for later.
Just test it! Copy the URL from one of your reports and open it into another browser, paste the URL, login to your Google Analytics account and you will see this enhancement in action.
12. Simple Goal Creation
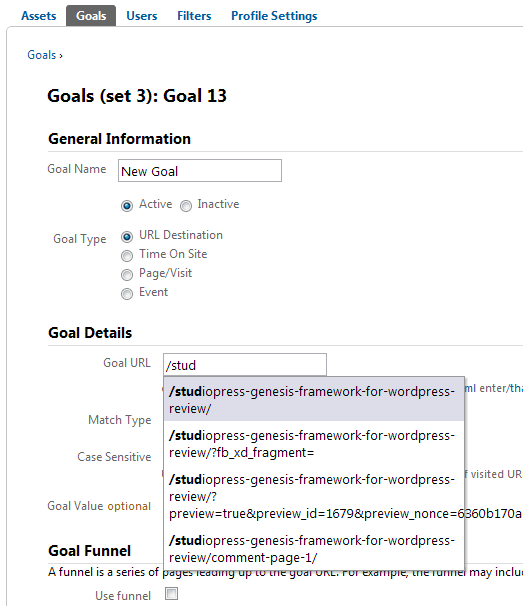
The goal creation has also been simplified in the new version of Google Analytics by adding the auto-complete feature for the URL Destination goal type. If before you might have chosen a different URL by mistake your conversion data ended up to be inaccurate.
But now, the auto-complete feature will not allow you to make any mistakes.
13. Advanced Filtering Makeover
Advanced Filters lets you filter reports data and display it the way you want it. With the new version the Google Analytics team has improved the process and made it more easier for any user to create advanced filters on the fly.
However, do not try to overuse this feature, because sometimes a Custom Report will do this job a lot better that an Advanced Filter.
14. Term Cloud (Keyword Cloud)
One exciting SEO related feature is the Term Cloud or Keyword Cloud, which lets you display a cloud of terms used by visitors to reach your website from search engines based on Visits, Pages/Visit, Avg. Time on Site, % of New Visits or Bounce Rate.
Using this feature you can visualize which of your keywords are most used, thus rank better in search engines and have a higher search volume. Or you can see which of them have a high Bounce Rate, which means that the landing page does not provide the information visitors are looking for.
To check this feature, go to the [Traffic Sources] report > [Sources] > [Search] > [Organic] and select the [Term Cloud] view from the section just below the chart.
Conclusion
The new Google Analytics provides some powerful features that will help you get more insights out of your data.
I hope that with this article I helped you better understand the new version of Google Analytics so you can get more insights out of your visitor information. Let me know if I succeeded.
If you have any questions, just use the comments form below to ask them. In case you want to share a Google Analytics story, feel free to use the same form to do it.



I’ve not yet tested GA v5, but your post is alluring enough. Will switch to v5 this weekend to try out some of these awesome additions.
This is the reason why I wrote this article, because there are still users who haven’t switched already.
But I hope, like in your case to show them what they miss and convince them to switch.
If you have questions or have any comments after the switch, please let me know.
Excellent, thorough post. Makes me realize, I should really spend some more time setting up Goals and analyzing a few other key metrics.
Setting up goals is one if the first things that you should do in Google Analytics and that is the reason why I cover them in the first lessons of my course.
Go ahead and setup goals to see who subscribes to your newsletter, who downloads your free eBook, who stays on your site more than 1 minute and who reads more than 2 articles of yours. These are fundamental goals that you should have. Then, see who those people are, where they come from, who sends you that traffic and where they go.
There is some hard work involved, but later it pays of, because you know your readers and customers.
Let me know how it works. 🙂
Hi Eugene, followed through from your comment on copyblogger, great content! Thank you for the effort and the sweet share.
Lance, it’s good to see you here! Thanks for following me!
I do my best and I hope you enjoyed it. But if you have any questions, please let me know.
Excellent article Eugen. I’m a huge fan of the multi-channel conversion funnels on V5 and the custom dashboards. I haven’t set up the site speed code yet but I will definitely be doing that now. Thanks for the tip!
Being able to create and graph various advanced segments against each other and see how visitors interacted on your site before they converted provides extremely valuable information. I found this post on SEOmoz to be very helpful: http://www.seomoz.org/blog/the-greatest-attribution-ever-graphed
Keep up the great work!
Thank you so much Andrew!
I like multi-channel funnels and custom dashboards, but also tracking events as goals and plot rows help me get more insights from my Analytics data.
Noticed “The Greatest Attribution Ever Graphed” when they published and I have it somewhere in my Chrome tabs, but I didn’t managed to read it thoroughly. 🙂
Thanks again!
Eugen
Very helpful post, thank you so much! I’m excited to test out these new features now.
Gaelen
Thanks Gaelen!
Let me know how the tests will go or if you have any questions.
thanks, by the way, this is why google is the 1st search engine out there
I strongly agree.
It is impressive that Google have made these changes, but I find them mainly cosmetic. The underlying truth is that most of these features were already available. I am impressed with how well google analytics works and I anyway suggest its usage, but this new version adds not much special.
You are perfectly right, Paul.
Most of these features existed already in Google Analytics but the majority of users do not really use it a it’s maximum power, so it good sometimes to have a redesign and make it easier for users to get more out of an application.
Is a great tool from Google with free features, usefull
Hi Eugene,
I am trying to implement Google Analytics on a University web-site. There is no fixed user path or very defined goals here. Was wondering how you would approach such non-commercial and information-centric web-sites?
Cheers,
A
Hi Adarsh,
There is plenty of stuff you can measure on a non-commerce website and I am touching some of them in my 3rd lesson of the Google Analytics course and this article:
https://eugenoprea.com/measure-readers-engagement/
But to summarize, you can measure the engagement of your visitors with pages from your website, how much they stay on your pages, how many articles they read, what is their engagement…
Also, you can measure the downloads of a whitepaper, brochure, eBook or who fills out the contact form. If you also check my first lesson, I am speaking there about business goals, so you should start asking yourself what is the goal of the website? What do you want to achieve with it? Then, you can start to apply those goals in Google Analytics and measure them.
The purpose of a University website (one that I can think off) is to inform candidates about the University and ultimately make them apply for it. So, one thing that you would want to measure is who fills out the contact form. From where those visitors come (search engines, referrals), how engaged are different visitors from different sources, what sources you can leverage to send you more visitors and examples can continue.
I hope this helps, but if you have any other questions, let me know.
Eugen
Eugen this article is fantastic. I will save it and bookmark it. Great content and is worth repeating
Amid, thank you for checking it out!
I will do my best to keep this level of quality for my articles.
Awesome article. Thanks for sharing your insight.
Thank you Stephen!
I am glad that you enjoyed it.
Thanks Eugene, that was helpful…
I really appreciate this compendium of the new Google version, I got a mail from them with the new inclusions but yours is quite better.
Do you know if they are releasing the “flow visualization” feature as well?, I find it quite appealing as well.
All in all I’m still using the previous versions due to lack of PDF exports, so hopefully I’ll move once they cover that part.
Thanks a lot.
Hi!
I really like the new V5, but regarding Custom Reports, why is it, that one can’t choose dimentions from your ecommerce data? Like products?
Nikolaj, that is because eCommerce data, like the number of products sold or conversion rates are not actually dimensions, but metrics. So you will have to add them in the metrics section.
I am still delving deeper into the new version but I cannot seem to find where you can look at site visitors by hour. In the previous version you could track site traffic by hour in the visitors section under visitor trending. Just curious is this is still a function or not. Nice post!
Rob, with the version V, Google has taken some features from the app, but I am sure that they will add some improved versions of them.
Does anybody know if this is going to happen soon or not?
You should be able to select hourly metrics if you select that from the chart.
What has happened to “user defined” reports – anyone know. I cannot find any mention of them. Love the “word cloud”!
You can still create custom reports, if this is what you are after.
This is a very good coverage of the features of Google Analytics. It is so great to have such tools from Google. The YouTube video was a nice touch.
I always like to use all the resources I have: text, images and even video where possible, because different people learn differently.
When configuring events, does it matter if I use “that is equal to” or “that matches” when setting category or action values? What is the fundamental difference?
James, I usually choose “is equal to”
Am tyring to figure out how to know the links visitors clicked on my page, I wish it was easy on Google analytics like it is in wordpress stats.
Seb, to do this, you will need to implement event tracking.
https://eugenoprea.com/google-analytics-event-tracking-measure-call-to-actions/
Hi Eugen,
Thanks for a great article, I will definitely try some of your suggestions above. One aspect that I don’t like about the new version is the loss of the summary screen when you first open analytics. I usually monitor around 10-15 websites at once, previously when you opened analytics there was a great summary page of all of your sites, number of visits and trends on the previous month (% increase or decrease), with a quick glance I could tell if my sites were doing well or not. That doesn’t exist in the new version, it just lists the websites with no data or trends, it feels a bit like I’ve had the wool pulled over my eyes, do you know if there is anyway to configure the new version to display the information it used to on the opening page?
Thanks
Mat
Eugen,
Do you have any idea how to find the service provider section on the new version of Google analytics? Thank you!!
Hi Ryan,
I was having the same problem as you. Double check your dashboard – if not search for ‘Service Provider’ – you should find a simplified list, compared to the older version of Analytics its layout is less complicated (the first few bullet points are colourful!).
Good Luck!
Hi Meg, thanks for chiming in!
The new Service Provider report can be viewed under Audience > Technology > Network.
Eugen
Hi Eugen,
Thanks for all the information. Really thorough article.
I am currently stuck on the new version of Google Analytics and wonder if you can help me? When looking at who has viewed your website, do you know how to view the different Service Providers and Domain Names? In the old Analytics I would access this via ‘Network Locations’ then automatically see a list of the different Service Providers. But I cant seem to find this anywhere on the new Google Analytics.
Many thanks,
Meg
Very interesting and exciting stuff Eugene.
I’ve dabbled with other analytics software but once again google delivers!
Hi,
i have a question about the time settings for my report. Is it possible to compare Visits from this month with visits genereted last month and put this result to your dashboard? I gained the impression that time settings cannot be saved. Even when i use the “timeline” für a widget analytics does not allow to define a period. It would be a big help to get infos about this. Thanks
Dirk, you can create a dashboard with visits, but you will have to manually select the dates and compare to past.
trackPageLoadTime is deprecated because Site Speed reporting is enabled automatically for all users.
https://developers.google.com/analytics/devguides/collection/gajs/methods/gaJSApiBasicConfiguration#_gat.GA_Tracker_._trackPageLoadTime
Thanks Jim!
I will make sure to update the article accordingly.
Hi Eugen, I’ve been using GA to see page views, number of visitors, sources of traffic and to track content people have read. I had no idea it could do so much and I’m excited to learn more now. Your article has opened my eyes to the full functionality of what GA can offer and I’m excited but a little nervous. I’m looking forward to using your ecourse to help me get up to speed.
Thanks Georgina!
It’s never too late to learn new things about GA. Do let me know how is it going and if you have questions.
Thank for very much ..
i Started using analytics after reading your blog it really helped .
now i get each report .